Community resources
Community resources
Community resources
- Community
- Products
- Jira Service Management
- Questions
- How to export Cycle time report 12 week or monthly median data
How to export Cycle time report 12 week or monthly median data
Hello
I can access cycle time report like this:-

This report gives us weekly median. But my requirement is to get the median of the July data. So I want to export the issues deployed in the last two deployments (3rd July and 17th July), and get median of the data.
Num of issues shipped on 3rd July = 40 issues
Num of issues shipped on 17th July = 9 issues
So, I want to export all 49 issues, sort them out and take the median
Please suggest way to export or to get the data in one go
Thanks
4 answers
Hello @Prashant K Sahni 👋
If you're looking for add-on, you can try Time in Status for Jira Cloud (developed by my SaaSJet team). Create the Cycle time report easily and display it on your board and export it to CSV or XLSX files for further analysis.
All you need is to:
- create a status group;
- choose statuses;
- click the "Save" button.

As an alternative, you can try a solution described in this short use case on how to get Cycle and Lead time for Jira issues.
Also, you can read the article which describes some ways to get the Cycle time report for your issues.
Add-on has a 30-day free trial version and free up to 10 users.
Please, let me know if you have any questions
Hope it helps 😌
Valeriia
We are calculating results for the DORA metrics. In DORA metrics there is an attribute "Lead time for changes", which is the time from first commit to the time the issue is deployed to production
So cycle report giving us that output. But it is giving us weekly median, I want monthly median. Please understand.
I want to calc. cycle time from DORA metrics point of view.
I don't want to calculated time from "Todo" to "Done", that is already given by control chart in JIRA
You must be a registered user to add a comment. If you've already registered, sign in. Otherwise, register and sign in.
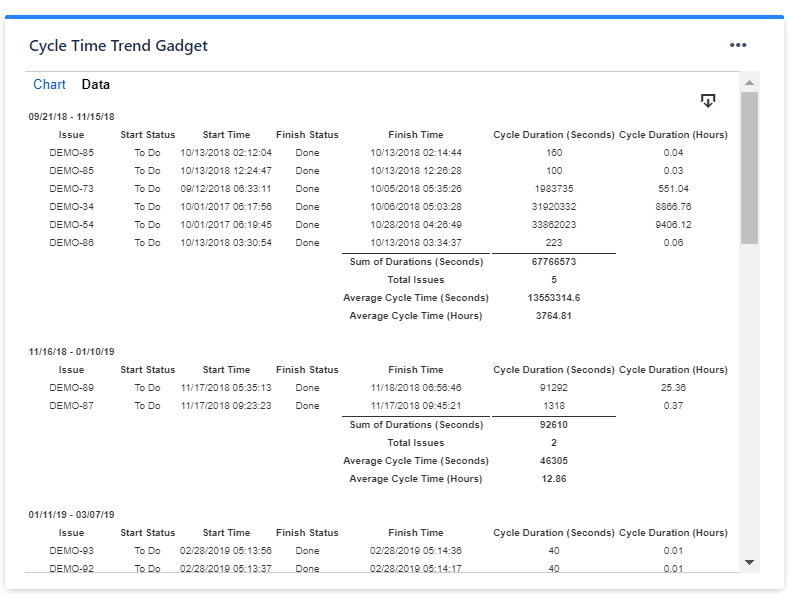
Our Great Gadgets app offers a Cycle Time Trend gadget that can calculate the average cycle time for past intervals and can display the linear or polynomial trend in time. You define the cycle (for example, from creation to done, from new to in progress, from status X to status Y, etc) and you define the length of the intervals from the chart (currently from 1 to 8 weeks, but we can add the 12 weeks option for you).
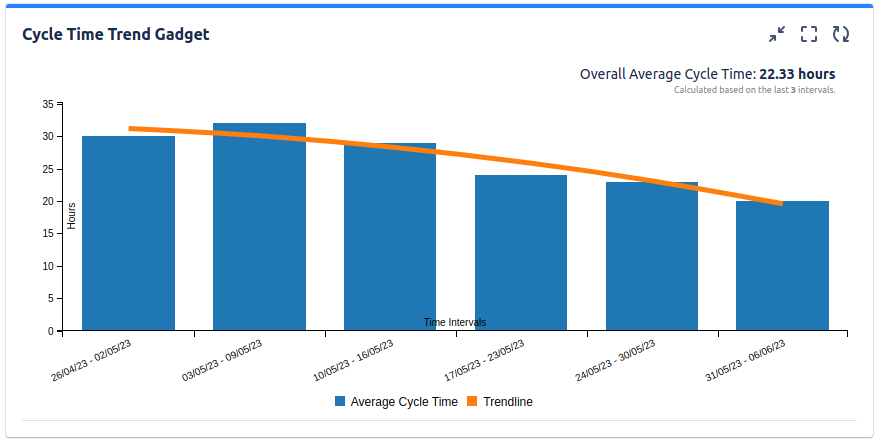
The gadget offers also a data tab that can be exported in CSV.
I think it could fully-fill your request, if you would have workflow status in Jira for first commit and deployed-to-production.
This app offers many other gadgets that you will find useful.
If you have questions, please don't hesitate to contact us at support@stonikbyte.com.
Thank you,
Danut Manda
You must be a registered user to add a comment. If you've already registered, sign in. Otherwise, register and sign in.
If you prefer to use a marketplace app to get cycle time (the time it takes for the team to start working on an issue and complete it) reports, you can try Status Time Reports app developed by our team. It mainly provides reports and gadgets based on how much time passed in each status.
Here is the online demo link, you can see it in action and try without installing the app. You can have a look at Cycle Time for Each Issue report, Cycle Time by Assignee report, Cycle Time by Project report, Cycle Time by Issue Creation Month report, Cycle Time by Components report as examples.
For more detail, you can have a look at Cycle Time and Lead Time in Jira: Productivity Measurement with Two Critical Parameters article and Status Time Reports How to Videos.
If you are looking for a completely free solution, you can try the limited version Status Time Free.
Hope it helps.
You must be a registered user to add a comment. If you've already registered, sign in. Otherwise, register and sign in.
We are calculating results for the DORA metrics. In DORA metrics there is an attribute "Lead time for changes", which is the time from first commit to the time the issue is deployed to production
So cycle report giving us that output. But it is giving us weekly median, I want monthly median. Please understand.
I want to calc. cycle time from DORA metrics point of view.
I don't want to calculated time from "Todo" to "Done", that is already given by control chart in JIRA
You must be a registered user to add a comment. If you've already registered, sign in. Otherwise, register and sign in.
Just to be clear, cycle time reports I've mentioned above doesn't calculate the time from status "To Do" to status "Done". Cycle time is the time it takes for the team to start working on an issue and complete it. In other words, cycle time starts when an issue is moved to “In Progress“ status and ends when the issue is moved to “Done” status.
You must be a registered user to add a comment. If you've already registered, sign in. Otherwise, register and sign in.
@Mehmet A _Bloompeak_
I request you before suggesting me solution, kindly please see the screenshot in the question very2 carefully and read the problem again
You must be a registered user to add a comment. If you've already registered, sign in. Otherwise, register and sign in.
As far as I know there is no way to export this built-in cycle time report.
One workaround might be getting first commit information and deployment time using Jira's REST api and then calculating the metric. There is the below rest api for commit information of an issue.
/rest/dev-status/1.0/issue/detail?issueId={YOUR-ISSUE-ID}&applicationType=bitbucket&dataType=repository
- [JSWCLOUD-16901] Provide a public REST API endpoint to get development info associated with an issue
You may want to vote and watch the above feature request so that you will get notified in case of any update.
You must be a registered user to add a comment. If you've already registered, sign in. Otherwise, register and sign in.
Hello @Prashant K Sahni
Jira's Cycle Time report considers both issues and commits. I believe this might be misleading but that is how Jira does it. A better approach would be to measure the Cycle Time based on Jira issue statuses.
If you are OK with measuring this through Jira issue statuses, I can recommend a solution with an app. Our team at OBSS built Timepiece - Time in Status for Jira exactly for this. It is available for Jira Server, Cloud, and Data Center.
Time in Status mainly allows you to see how much time each issue spent on each status.

You can combine the time for multiple statuses to get metrics like Idea Age, Lead Time, Cycle Time, etc.
For all numeric report types, you can calculate averages, sums, median and standard deviation of those durations grouped by the issue fields you select. For example total in-progress time per component or average cycle time per product, etc. The ability to group by parts of dates (year, month, week, day, hour) or sprints is particularly useful here since it allows you to compare different time periods or see the trend.

The app calculates its reports using already existing Jira issue histories so when you install the app, you don't need to add anything to your issue workflows and you can get reports on your past issues as well. It supports both Company Managed and Team Managed projects for Jira Cloud.
Time in Status reports can be accessed through its own reporting page, dashboard gadgets, and issue view screen tabs. All these options can provide both calculated data tables and charts.


Timepiece - Time in Status for Jira
EmreT
You must be a registered user to add a comment. If you've already registered, sign in. Otherwise, register and sign in.
We are calculating results for the DORA metrics. In DORA metrics there is an attribute "Lead time for changes", which is the time from first commit to the time the issue is deployed to production
So cycle report giving us that output. But it is giving us weekly median, I want monthly median. Please understand.
I want to calc. cycle time from DORA metrics point of view.
I don't want to calculated time from "Todo" to "Done", that is already given by control chart in JIRA
You must be a registered user to add a comment. If you've already registered, sign in. Otherwise, register and sign in.

You must be a registered user to add a comment. If you've already registered, sign in. Otherwise, register and sign in.