A pop-up survey could appear while you're here--curious what it's for? Click here to learn more!
×Community resources
Community resources
- Community
- Products
- Confluence
- Questions
- Confluence: possibility to show the sum of story points?
Confluence: possibility to show the sum of story points?

Hi,
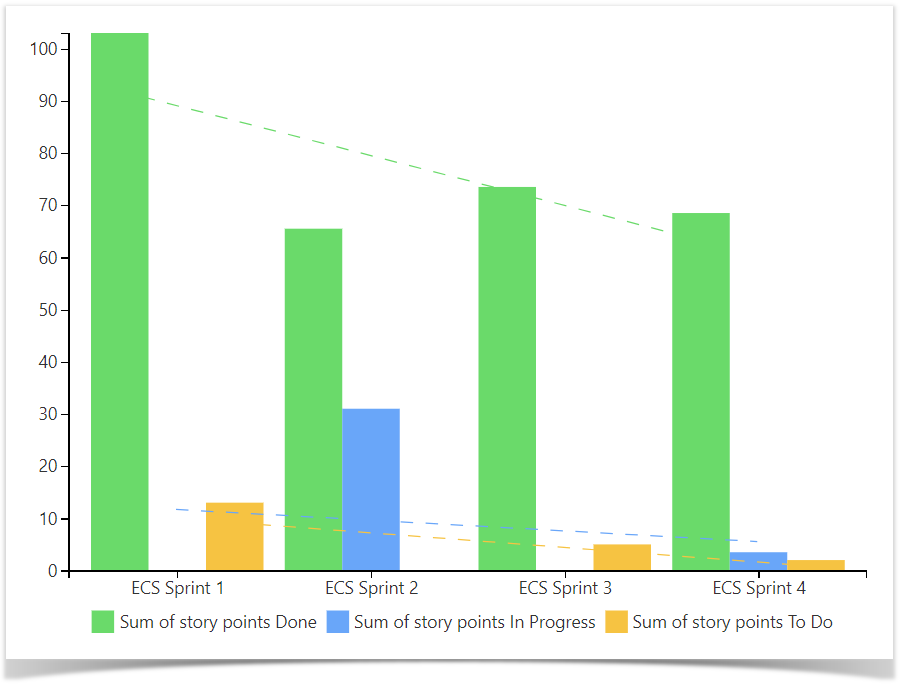
Are there a free solution to show the sum of story points per sprint in confluence or Jira Dashboard?
Something like this:
----------------------------
| Status | Story Points |
----------------------------
| TODO | 5 |
| InProgress | 7 |
| Done | 2 |
| Total | 14 |
Thanks a lot for your help.
1 answer

Hi @Julio Helden ,
You can't perform any data aggregation and calculations via standard Confluence tools. But you can try to use additional apps to enhance your Confluence instance - install the Table Filter and Charts for Confluence app.
The app works perfectly well with the Jira Issues macro and all you need to do is to follow this instruction.
Here you need to wrap your Jira macro in the Table Filter macro and then into the Pivot macro to aggregate your data and calculate the sums and totals. If you decide to follow the example strictly, you may go further and use the Chart from Table macro and visualize the result table.
Note that if your hosting type is Cloud, you need to use the Table Toolbox macro to nest multiple macros.
Hey @Katerina Kovriga _Stiltsoft_
In an effort to maintain transparency in the Community, please be sure to clearly identify this as your company's application and state your affiliation with the company when responding to Community posts. Please have a good read-through of the other Atlassian Community online guidelines for Marketplace vendors and Solution Partners.
One more thing, @Julio Helden was asking for a free solution for his use case. :)
Thank you!
Best, Max
You must be a registered user to add a comment. If you've already registered, sign in. Otherwise, register and sign in.

You must be a registered user to add a comment. If you've already registered, sign in. Otherwise, register and sign in.