You may be experiencing slow load times on the forum; the team is working to resolve this ASAP.
×Community resources
Community resources
Done column filter in Control Chart gives "This Chart Cannot be Displayed"

I have three columns set up in my board (To Do, In Prog, Done). In my workflow, there are 5 states (Captured, Ready, In Prog, Done, Accepted). The mapping between the columns and workflow state is as below
- "To Do" column-> Captured, Ready
- "In Prog" column-> In Prog
- "Done" column-> Done, Accepted
Note: In the workflow, only the issues marked as "Accepted" will have their resolution as "done".
I created a quick filter ("test filter") on the board which will result in just one issue which is in "Accepted" state. When I generate the control chart and filter by the "test filter", the issue appears when filter by "To Do", "In Prog" column filters but not when filter by "Done".
My understanding was the issues that appear on the chart shows the time spent on the specified status (specified by applying the filter). Which makes sense, and the times are in line with the "history" timeline of the task.
Please help me figure out why it's not shown when filtered by the status "Done".
Thanks in advance
1 answer
Hi @Ridmi Jayasena,
You could also try our app Great Gadgets for Jira Server or Great Gadgets for Jira Cloud.
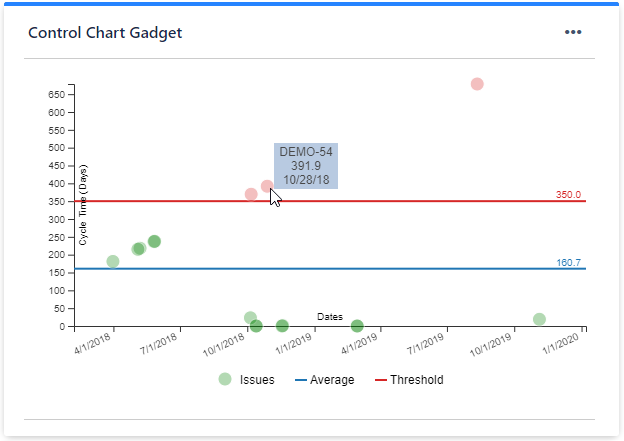
One of the 10 dashboard gadgets included is the Control Chart gadget, which is based on a Jira filter and is fully customizable.
See https://bitbucket.org/StonikByte/great-gadgets-add-on/wiki/Home#!control-chart-gadget


You must be a registered user to add a comment. If you've already registered, sign in. Otherwise, register and sign in.