Community resources
Community resources
How to customize a dashboard

My management(IT team) have a requirement to show minimum, maximum and average story lifecycle.
I have checked Jira dashboard, there is an existing dashboard called: "Average Age Chart", after testing I found this chart counts average start from story create to done status, however, most of stories are created since business have an idea, they may take a long time before are assigned to IT teams, so our "Start time" shall be when assign to IT team(We defined a status in workflow for this action).
Now my question is, how can I customize an existing dashboard to define the start/end, and to pick out minimum/maximum in a month? We have IT team so if there is way for script development then we may be able to do more.
5 answers
1 accepted

Do you mean the lead time, or build cycle time for the issues? If so...
That is not possible with the built-in dashboard gadgets.
You could either investigate marketplace addon gadgets, or try using the Atlassian interpretation of a control chart. That control chart would allow seeing the measures and adding the filters you note. Please look here to learn more about that: https://support.atlassian.com/jira-software-cloud/docs/view-and-understand-the-control-chart/
Kind regards,
Bill
You can try Status Time Reports app developed by our team. It mainly provides reports and gadgets based on how much time passed in each status.
Here is the online demo link, you can see it in action and try without installing the app. For further details, you can have a look at Status Time Reports How to Videos.
- This app has a dynamic status grouping feature so that you can generate various valuable reports as time in status, time in assignee, status entry dates and status counts, cycle time and lead time, average/sum reports by any field(e.g. average in progress time by project, average cycle time by issue creation month).
- You can search issues by Project, Issue Type, Status, Assignee, Issue Creation/Resolution Date(and any other Date field) and JQL Query.
- Status durations are calculated according to the working calendar you define. Once you enter your working calendar into the app, it takes your working schedule into account too. That is, "In Progress" time of an issue opened on Friday at 5 PM and closed on Monday at 9 AM, will be a few hours rather than 3 days.
- You can set different duration formats.
- You can export reports in CSV file format and open them in MS Excel.
- You can also add this app as a gadget to your Jira dashboards and reach “Status Time” from Issue Detail page.
- You can enable/disable access to Status Time reports&gadgets and Issue Detail page per project, users, groups or project role.
If you are interested in cycle time and lead time, you can have a look at Cycle Time and Lead Time in Jira: Productivity Measurement with Two Critical Parameters article.
If you are looking for a completely free solution, you can try the limited version Status Time Reports Free.
Hope it helps.
You must be a registered user to add a comment. If you've already registered, sign in. Otherwise, register and sign in.
Hello @jiandong.luo ,
Jira's own Average Age Gadget, Resolution Time Gadget, and even the Control Chart offer very limited flexibility and details. For maximum details, you should use a marketplace app for this.
If you are OK with using a marketplace app, our team at OBSS built Timepiece - Time in Status for Jira exactly for this. It is available for Jira Server, Cloud, and Data Center.
Time in Status mainly allows you to see how much time each issue spent on each status or each assignee.


You can combine the time for multiple statuses to get metrics like Issue Age, Cycle Time, Lead Time, Resolution Time etc.
For all numeric report types, you can calculate averages and sums of those durations grouped by the issue fields you select. For example total in-progress time per customer or average resolution time per sprint, week, month, issuetype, request type, etc. The ability to group by parts of dates (year, month, week, day, hour) or sprints is particularly useful here since it allows you to compare different time periods or see the trend.

The app calculates its reports using already existing Jira issue histories so when you install the app, you don't need to add anything to your issue workflows and you can get reports on your past issues as well. It supports both Company Managed and Team Managed projects for Jira Cloud.
Time in Status reports can be accessed through its own reporting page, dashboard gadgets, and issue view screen tabs. All these options can provide both calculated data tables and charts.


Timepiece - Time in Status for Jira
EmreT
You must be a registered user to add a comment. If you've already registered, sign in. Otherwise, register and sign in.
If you want to report on Cycle/Lead time you'll need to add that functionality in Jira with an app, there are plenty in the Atlassian Marketplace.
For example, the Dashboard Hub for Jira – Custom Charts & Share Reports app, which is developed by my company, includes the Cycle time and Lead time pre-built gadgets to add to your dashboards. Additionally, it also provides dynamic filters to narrow down even more in the data you need to report on.
Hope it helps :) Please remember that there's a 30-day free evaluation period.
.jpg")
You must be a registered user to add a comment. If you've already registered, sign in. Otherwise, register and sign in.
Hi @jiandong.luo,
You actually need a gadget that calculates the time between two workflow statuses.
Our Great Gadgets app offers all you need. With this app you can track cycle time, lead time or time between statuses and display it in various forms.
And you can specify the start/end of the cycle:

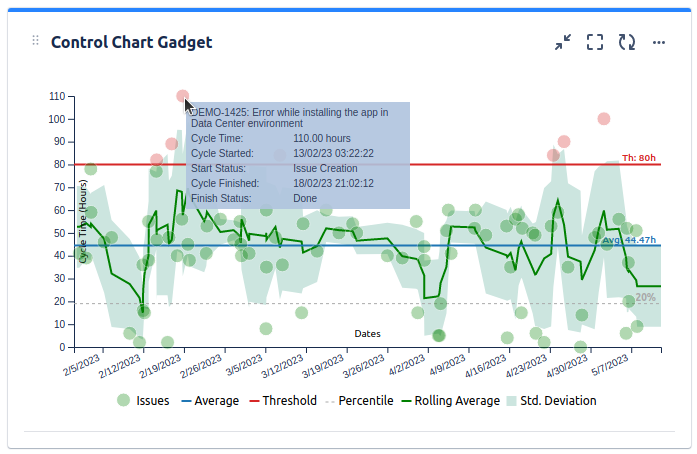
Control Chart - this displays the issues by their cycle time (time-between-statuses configurable by you) and allows you to see info about individual issues and what issues took longer than expected (the ones in red color)
Trend Chart - display the average cycle time, per part intervals, to see if your team improves their response along the time

Histogram Chart - display the issues by their cycle time, showing how many took longed
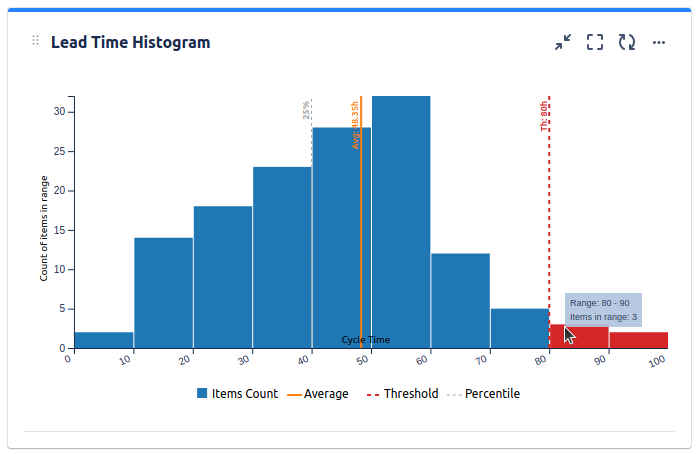
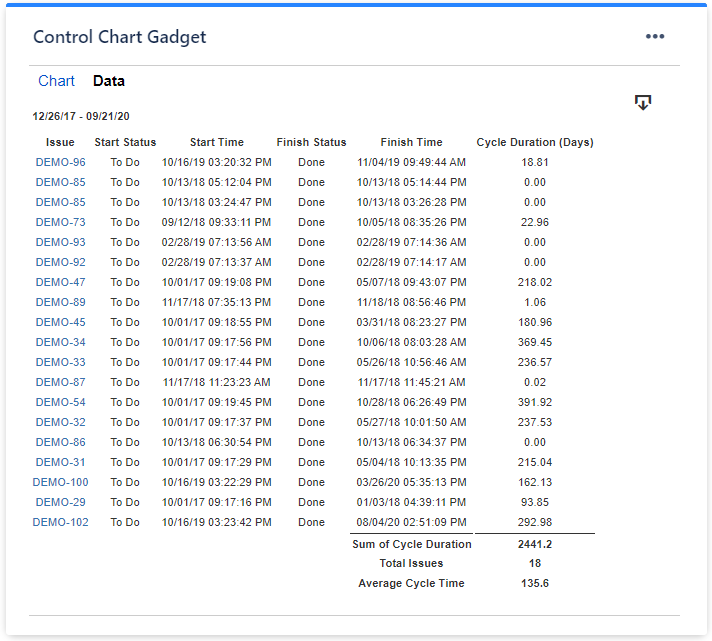
These gadgets offers also a Data tab with a report that you can export in CSV.
See also this article from our blog:
An effective dashboard for Service Desk and Customer Support teams in Jira Service Management
I hope this helps.
Danut.
You must be a registered user to add a comment. If you've already registered, sign in. Otherwise, register and sign in.

You must be a registered user to add a comment. If you've already registered, sign in. Otherwise, register and sign in.