Community resources
Community resources
How to make user workload report for complete team?

Need to make report for user workload for complete team.
4 answers
Welcome to the community !!
If you would like to try a mktplace app for tracking resource workload and capacity planning, take a look at
The app offers:
1. Resource Tracking and Allocation : The app allows you to monitor and track various resources by adding them as part of a template, and their work allocation across multiple projects / sprints.
2. Real-time Visualization: Provides intuitive charts, graphs to visualize resource utilization and capacity levels in real-time.
3. Full Sprint / Project Fix version Capacity and Monitoring

Hi @Priyanka Jha Roy ,
Welcome to the community!
For simple workload reports, you can make use of the native solutions such as: User Workload Report, Workload Pie Chart Report, Time Tracking Report.
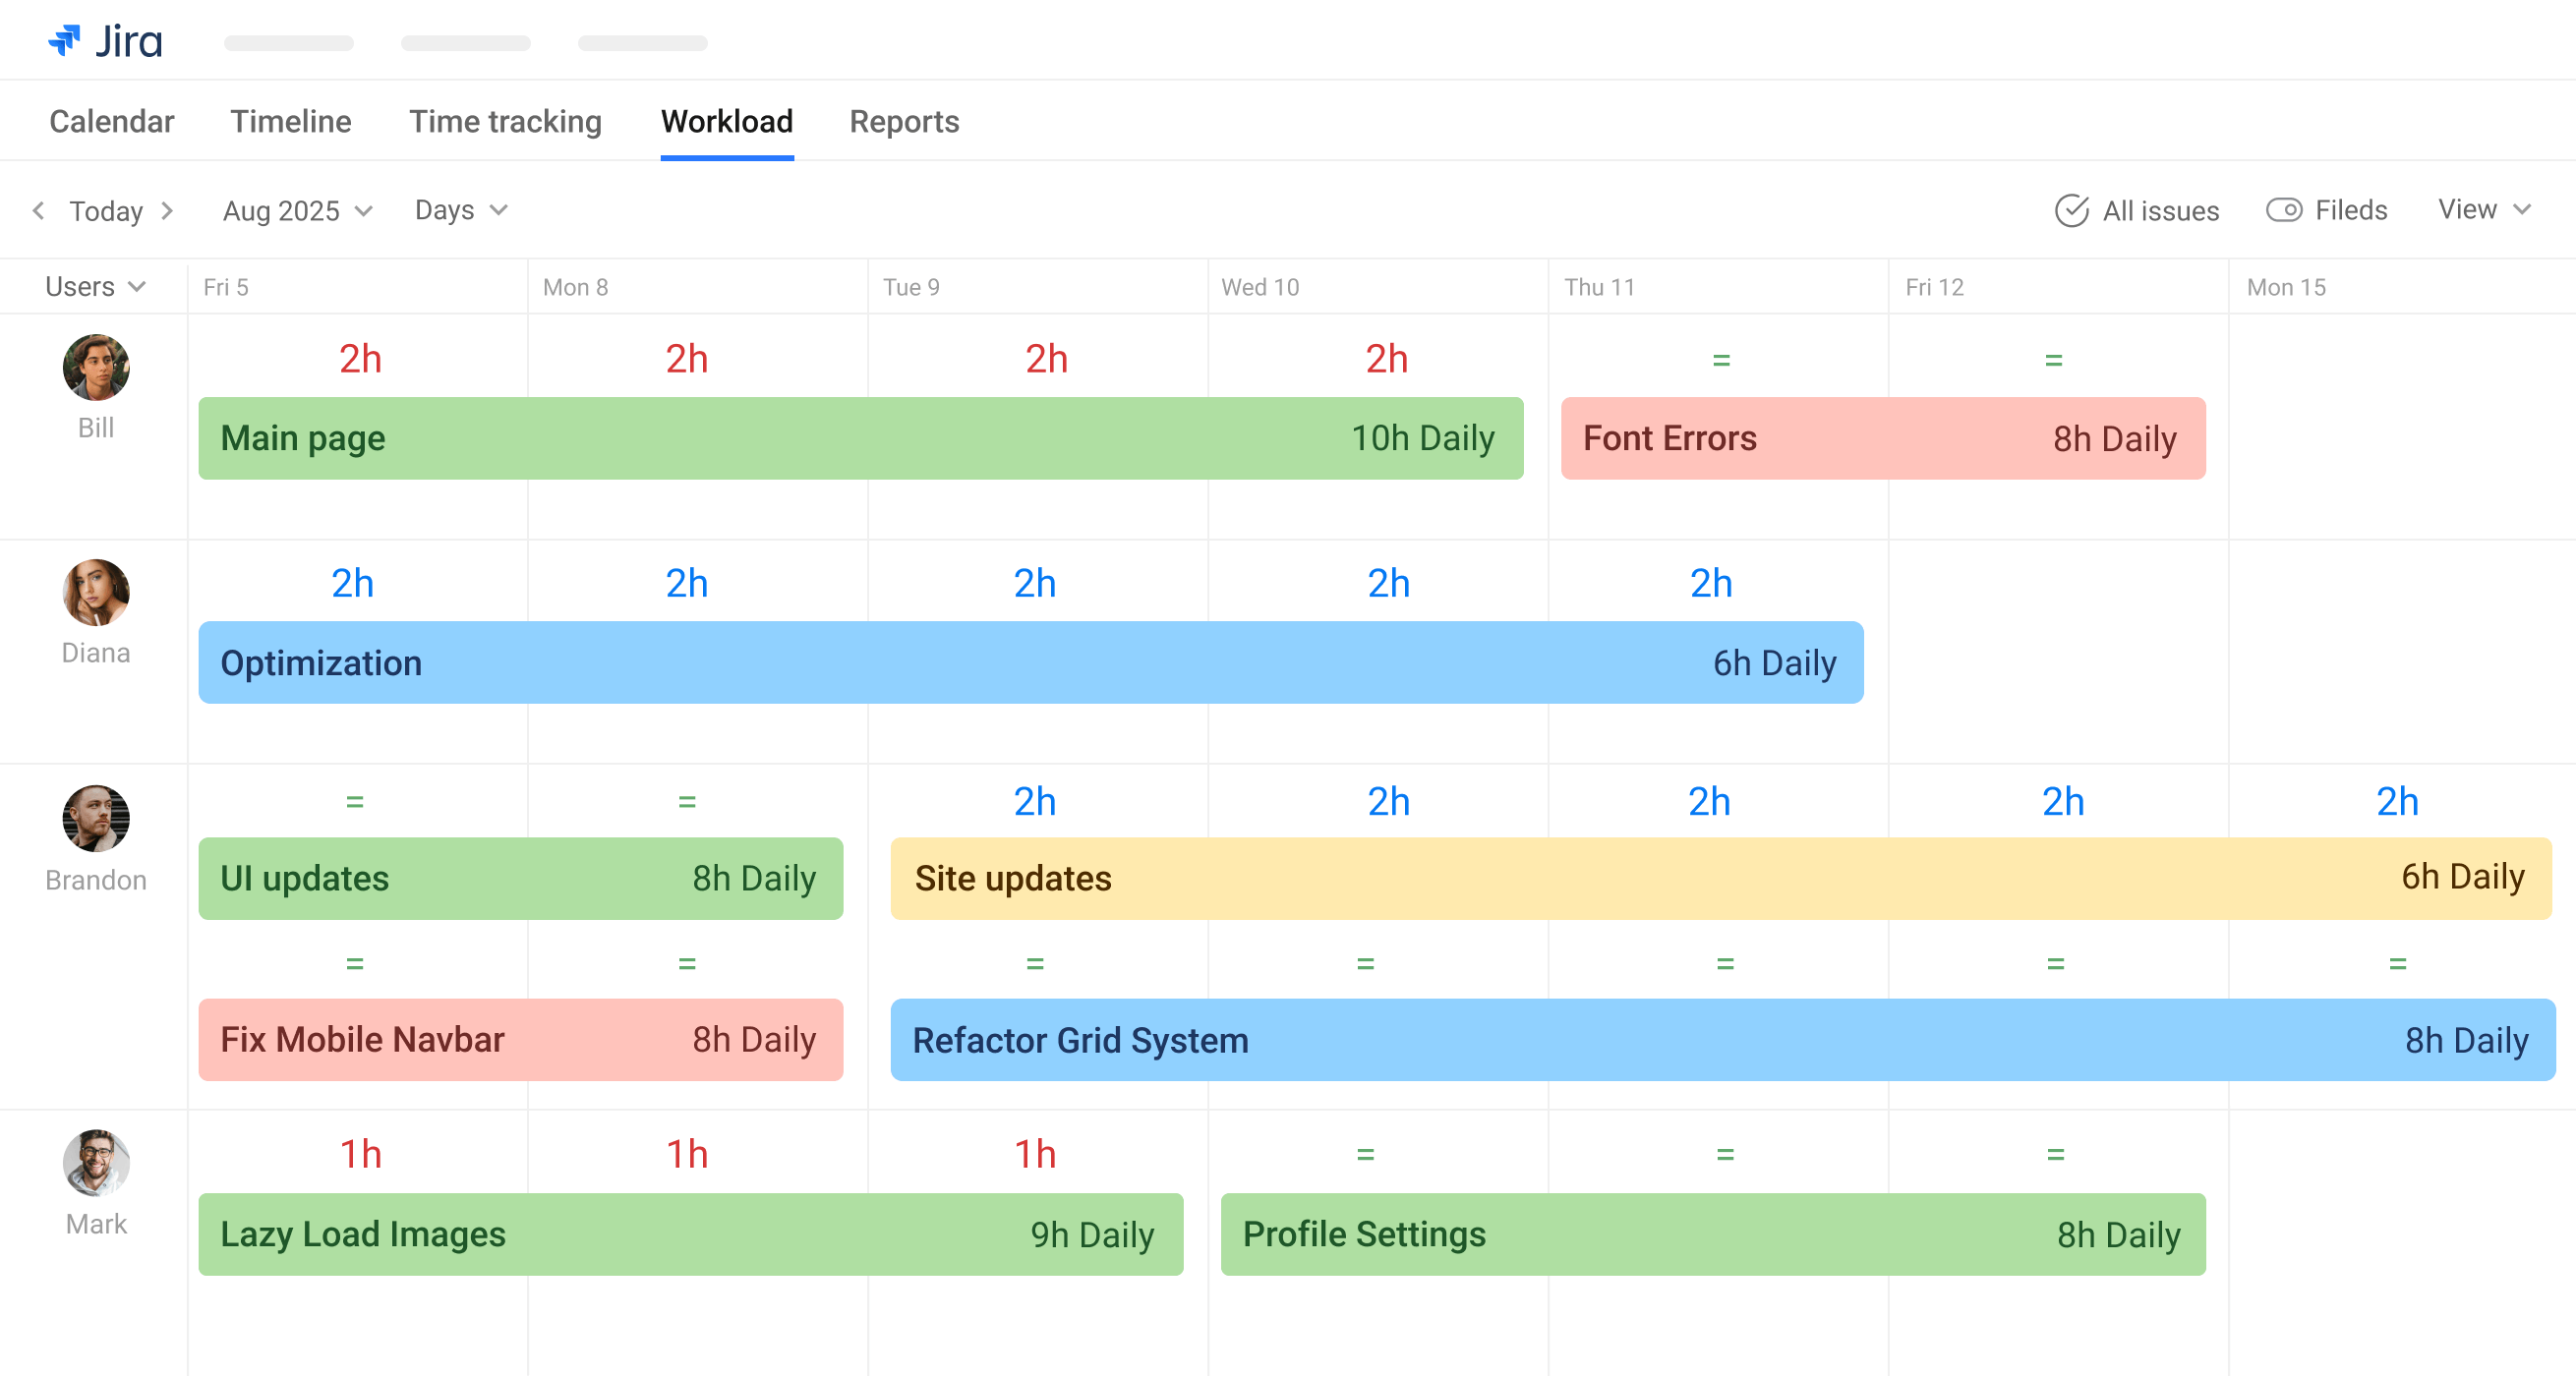
Moreover, in terms of third-party marketplace apps for setting up and tracking workload report, I can suggest our in-house solution, developed by SolDevelo called 'Team Planner –Resource Planning and Capacity Planning'.
Team Planner allows you to set up capacity planning for your team within an easy-to-use timeline format.

With Team Planner, you can add new users, drag and drop Jira work items (issues) across multiple projects on a timeline, assign them to multiple users throughout multiple days, and track their progress with quick access to their Story points or Original estimates.
If you are interested in this solution, we kindly invite you to check it out!
Regards,
Tomasz
You must be a registered user to add a comment. If you've already registered, sign in. Otherwise, register and sign in.
Here are several ways to create user workload reports for your complete team in Jira:
Native Jira Solutions:
-
Workload Pie Chart Report (built-in Jira report)
-
Shows distribution of work among team members
-
Access via Reports > Pie Chart Report > Select "Assignee" as the category
-
-
User Workload Report
-
Navigate to Dashboards > Add Gadget > "Assigned to Me" or "Assignee Statistics"
-
Shows open issues per team member
-
-
Time Tracking Reports
-
Use "Time Since Issues" or "Time Tracking" reports to see estimated vs actual effort
-
-
Jira Advanced Roadmaps (Jira Plans)
-
Provides team capacity planning and workload visualization
-
Add-on Solutions:
Planyway for Jira is particularly good for workload visualization and management:
-
Team Workload View: Visualizes capacity vs assigned work in a timeline format
-
Drag-and-drop Planning: Easily balance workloads by dragging issues between team members
-
Workload Indicators: Quickly see who's overallocated or underutilized
-
Time-based Allocation: View workloads by day/week/month with hour-level precision
-
Capacity Settings: Set individual team member capacities based on work hours/availability
Other Recommended Add-ons:
-
BigPicture for advanced resource management
-
ActivityTimeline for workload planning
-
Tempo Planner for capacity planning
You must be a registered user to add a comment. If you've already registered, sign in. Otherwise, register and sign in.
Hello Priyanka,
If you are using Jira Data Center then you can explore below options.
1. Built-in Jira Workload Pie Chart Gadget (Simple Dashboard Report)
Go to Dashboards → Add Gadget
Search for "Workload Pie Chart"
Configure it with:
Filter: (e.g. project = XXX AND statusCategory != Done)
Statistic Type: Assignee
Time Field: Original Estimate or Remaining Estimate
2. Built-in Two Dimensional Filter Statistics (Simple Dashboard Report)
Pro tip for JQL - assignee in (userA, userB, userC) AND resolution = Unresolved AND project = XXX
Then use "Two Dimensional Filter Statistics" gadget to break down by Assignee vs Status.
If you are using Jira Cloud then you can explore below options.
1. Dashboard Gadget: Workload Pie Chart
Go to Dashboards → Create or edit a dashboard
Click “Add gadget”
Search for Workload Pie Chart
Configure with:
Saved filter: e.g. project = ABC AND statusCategory != Done
Statistic type: Assignee
Time field: Original Estimate or Remaining Estimate
2. Use Filters + List View (Advanced Issue Search)
Go to Filters → Advanced Issue Search
JQL Example:
sql
Copy
Edit
project = ABC AND assignee IS NOT EMPTY AND statusCategory != Done
Add columns: Assignee, Original Estimate, Time Spent, Remaining Estimate
Click Export → CSV and build a pivot table in Excel or Google Sheets.
3. Advanced Roadmaps (if included in your plan)
Use Plans to track team workload and capacity across sprints.
You can define Teams, link them to boards, and view:
Team capacity
Sprint workload by user
Over/under allocation
You must be a registered user to add a comment. If you've already registered, sign in. Otherwise, register and sign in.

You must be a registered user to add a comment. If you've already registered, sign in. Otherwise, register and sign in.