Community resources
Community resources
Need to build a dashboard to monitor individual task lists and time spent on each level

Hi everyone,
I’m currently managing a team where we use Jira as our primary ticketing system. Here’s how our workflow looks:
- Client raises a Jira ticket (which automatically creates a default child ticket).
- Each child ticket needs to be assigned to different internal teams.
- Only one person (from my team) communicates with the client via the Epic ticket.
- My team assigns few child tickets to the respective internal teams and other tickets worked my themselves
- Other teams are not allowed to communicate in the Epic ticket.
- My team is responsible for checking the status of child tickets and updating the client in the Epic ticket.
- Since requests come from multiple account managers (client side), it’s becoming difficult to monitor ticket status. My team members are manually checking ticket progress and updating clients, which is time-consuming and challenging to track.
My request:
I’d like to explore ways to streamline this workflow and reduce manual effort. Specifically:
- Creating an individual dashboard in Jira for each team member (accessible to Team Leads).
- Tracking utilization to monitor workload and efficiency of each individual.
I’d love to hear your thoughts or recommendations on how to set this up effectively. Any best practices, Jira apps, or dashboard configurations that could help us manage this better would be really valuable.
Thanks in advance!
Thanks,
9 answers
Hi @Asif Khan
Welcome to the community !!
If you are open to try out a mktplace solution for this need, I can suggest
The app allows you to view your cross project hierarchy in a tree view. You can also view %complete progress at each parent level. It sums up the time tracking fields, story point or numeric fields at each parent level, along with a timeline view.
You can group the data by assignee and create a clear hierarchy view per assignee and track time spent at each issue level. The app can be added to a dashboard as well.
Disclaimer : I am one of the app team member

General Jira Best Practices & Configurations
Before diving into a specific app, let's consider some native Jira features and best practices:-
Standardize Workflows for Child Tickets:
-
Statuses: Ensure your child ticket workflows have clear, distinct statuses that accurately reflect progress (e.g., "To Do," "In Progress - Internal Team A," "In Review - Internal Team B," "Waiting for Client," "Done"). This makes it easier to track at a glance.
-
-
Jira Automation:
-
Status Syncing (Parent/Child): Consider setting up automation rules. For example:
-
When all child tickets of an Epic are "Done," transition the Epic to "Ready for Client Update" or "Done."
-
When a child ticket is transitioned to "Waiting for Client," you might automatically add a comment on the Epic for your team to see.
-
-
Assignments: While you manually assign, automation could help in scenarios where a specific ticket type always goes to a certain internal team by default.
-
-
Custom Fields for Accountability:
-
"Client Facing Contact": Add a custom user picker field to the Epic to clearly indicate who from your team is the primary client communicator.
-
"Internal Owner": On child tickets, this is already the assignee, but sometimes having a separate "Responsible Team Lead" field can be useful for escalation.
-
-
Notifications:
-
Fine-tune notification schemes so your team gets relevant updates on child tickets without overwhelming other teams with Epic notifications.
-
Dashboards for Monitoring and Utilization
This is where you can significantly reduce manual effort.-
Individual Team Member Dashboards (Accessible to Leads):
-
Create a shared dashboard and add gadgets for each team member.
-
Key Gadgets:
-
Filter Results Gadget:
-
"My Open Child Tickets" (assigned to current user, status not "Done")
-
"My Tickets Awaiting My Action" (assigned to current user, specific status like "Ready for Review")
-
"My Epics Awaiting Client Update" (assigned to current user, Epic status "Ready for Client Update")
-
-
Two Dimensional Filter Statistics Gadget:
-
X-axis: Assignee, Y-axis: Status (filtered by your team's child tickets)
-
-
Pie Chart Gadget:
-
Tickets by Assignee, Tickets by Status, Tickets by Priority (for your team's workload).
-
-
Issue Statistics Gadget:
-
Group by Assignee, then by Status, to see open tickets for each team member.
-
-
-
-
Team Lead Utilization Dashboard:
-
Filter Results Gadget:
-
"All Open Child Tickets for My Team" (assignee in your team, status not "Done")
-
"Child Tickets Overdue" (dueDate < now(), status not "Done")
-
-
Workload Pie Chart: Assignee (for your team's child tickets).
-
Created vs. Resolved Chart: To see trends in incoming vs. completed work.
-
Resolution Time Gadget: To track how long tickets take on average.
-
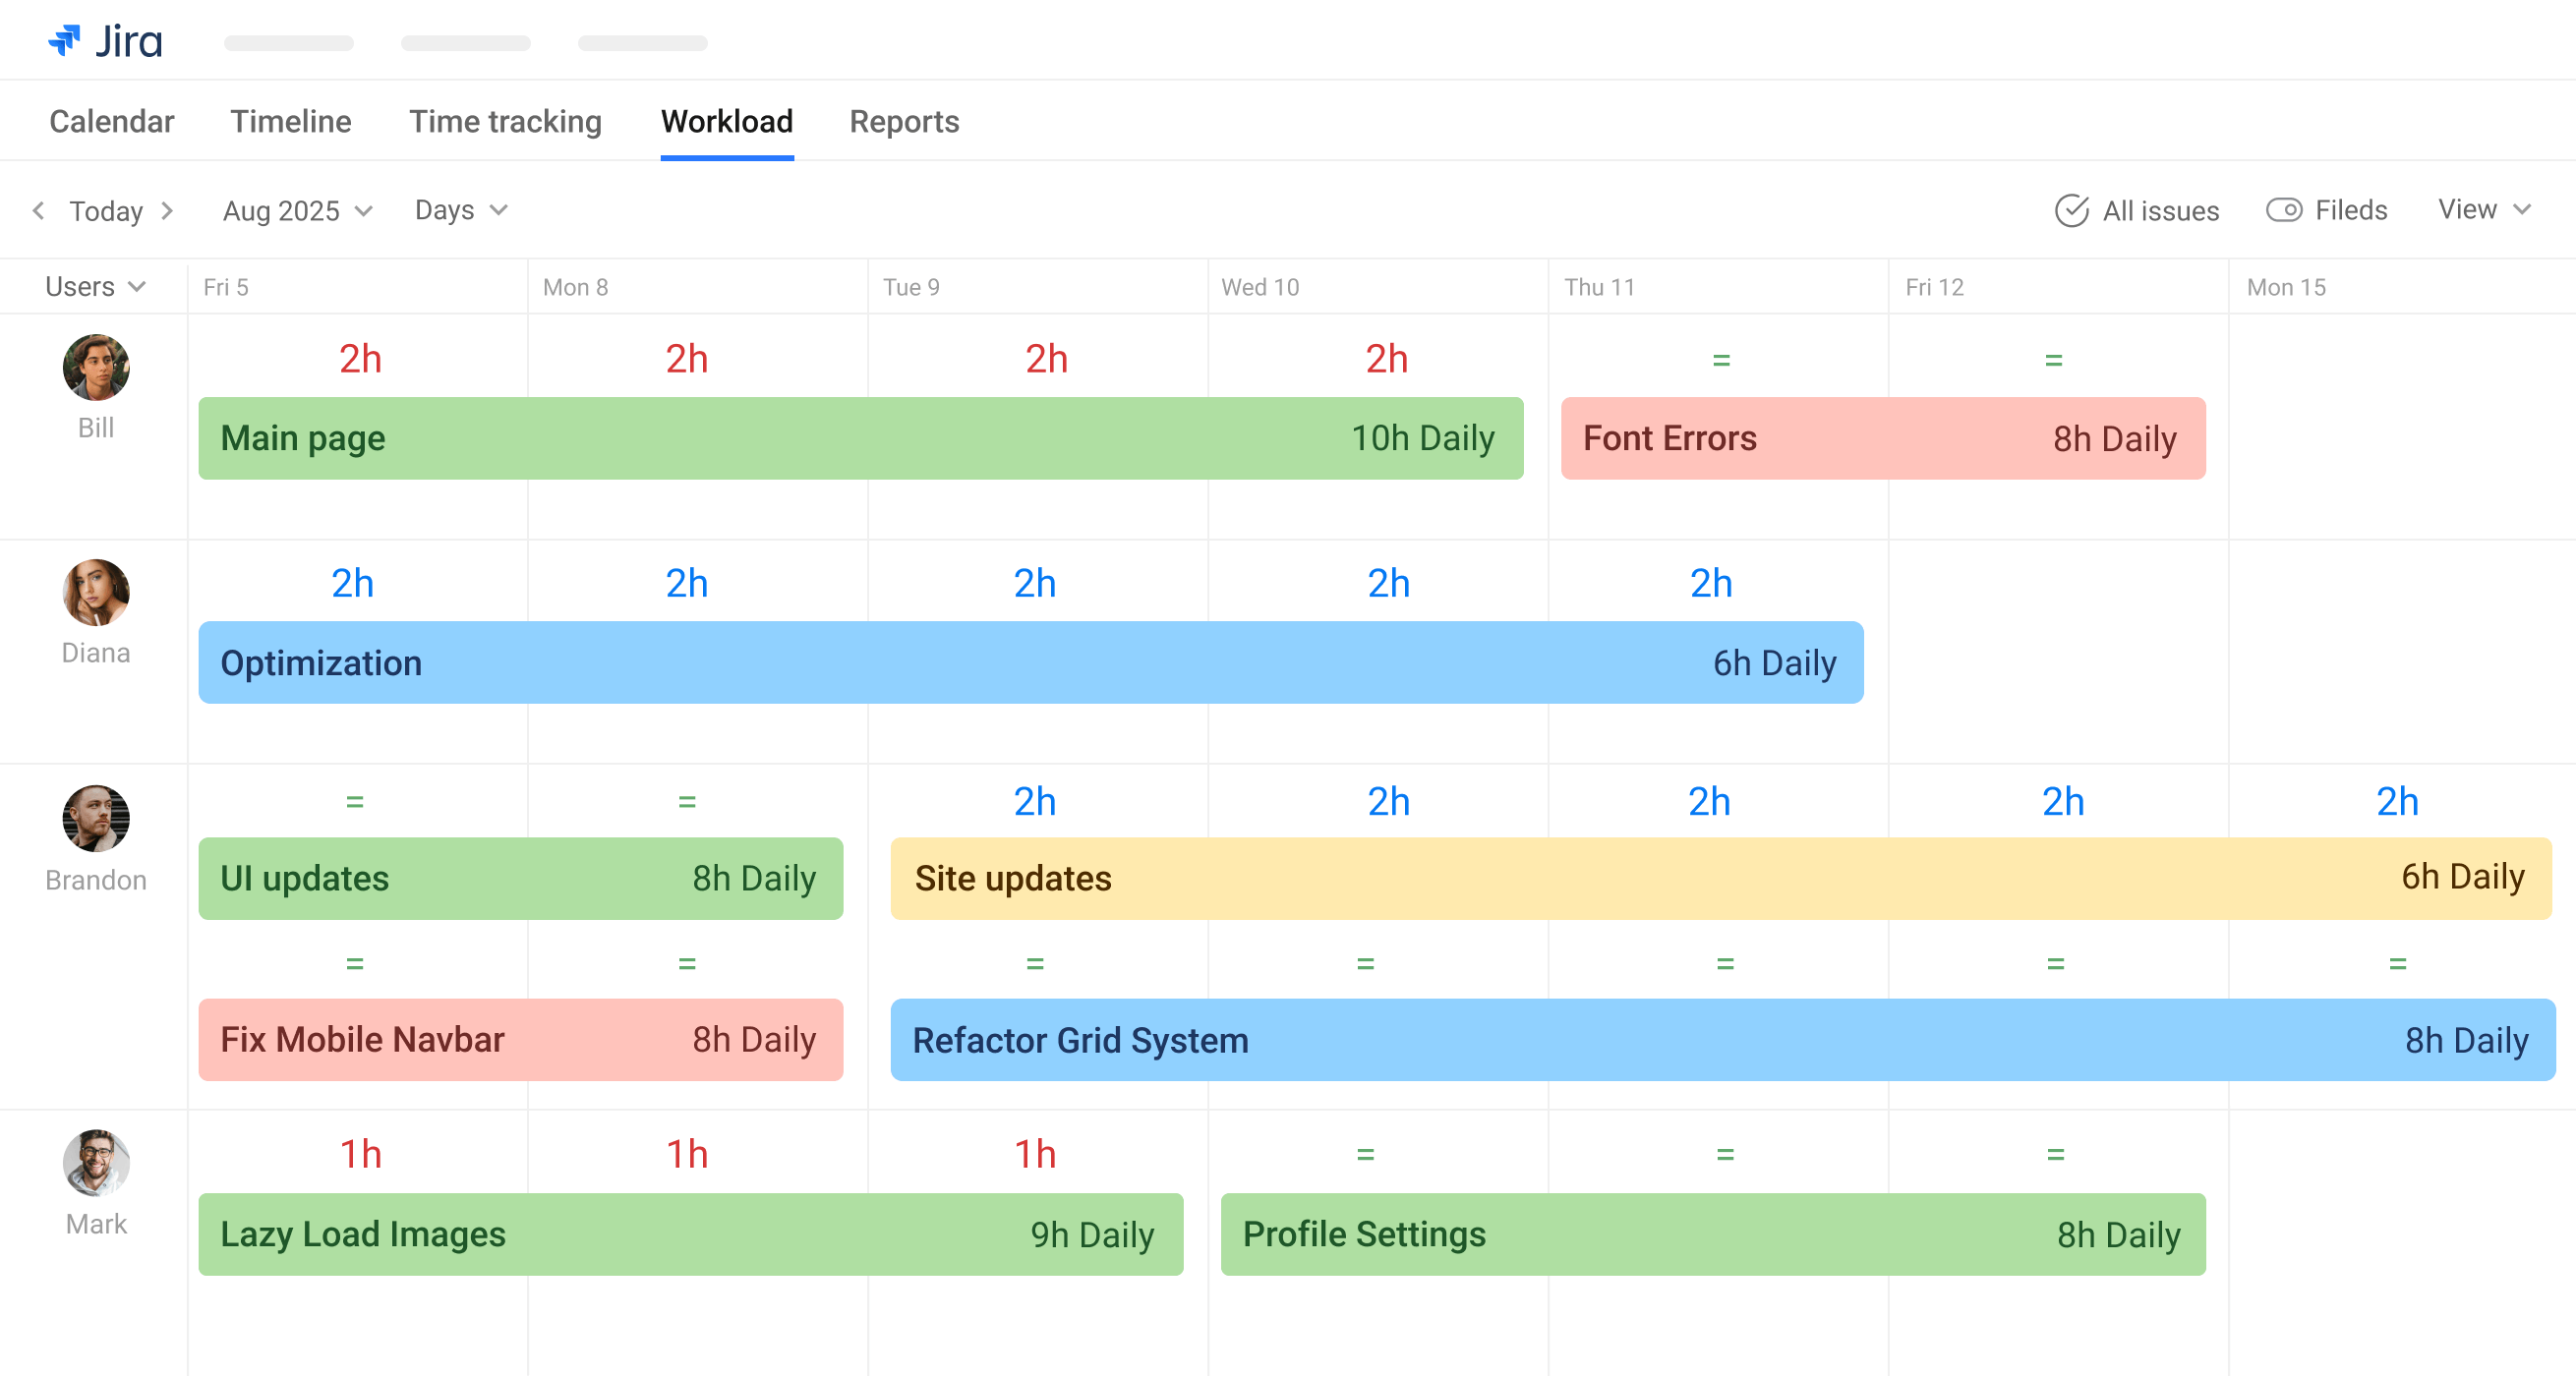
Introducing: Planyway for Jira
This is where a tool like Planyway for Jira can truly elevate your workflow management and solve many of your pain points, especially regarding visualization, planning, and workload management.How Planyway helps:
-
Visual Timeline & Calendar View:
-
Drag-and-Drop Scheduling: Instead of just a list of tickets, Planyway gives you a visual calendar or timeline where you can drag and drop Jira issues (Epics, child tickets) to assign them to specific team members and schedule them.
-
Dependencies: Easily visualize dependencies between child tickets and the main Epic, helping your team understand the overall progress.
-
Proactive Planning: Your team can proactively plan their week/day, reducing the need for constant manual checking. They'll see what's coming up and what's due.
-
-
Workload Management & Utilization Tracking:
-
Real-time Workload Indicators: Planyway provides immediate visual feedback on individual workloads. You can see at a glance if someone is over-allocated or has capacity. This directly addresses your need for "tracking utilization to monitor workload and efficiency of each individual."
-
Capacity Planning: Set individual capacities for your team members. When you assign tasks, Planyway will show if they are reaching or exceeding their capacity. This is fantastic for resource allocation and preventing burnout.
-
Effort Estimation Integration: If you're using time estimates in Jira (e.g., Original Estimate), Planyway can use these to inform workload calculations, giving you a more accurate picture of utilization.
-
-
Enhanced Monitoring for Team Leads:
-
Consolidated View: Team Leads get a single, visual interface to see all ongoing work, assigned tasks, and progress across the entire team, for both Epics and child tickets. This means less jumping between different Jira filters and dashboards.
-
Quick Status Checks: Instead of clicking into each child ticket, you can often see the status directly on the Planyway board or timeline, especially if you configure color-coding for statuses.
-
Identify Bottlenecks: Easily spot where tasks are piling up or where a team member might be stuck, allowing for proactive intervention.
-
-
Improved Communication (Internal):
-
While only your team communicates with the client on the Epic, Planyway improves internal visibility. Everyone sees the bigger picture and how their work fits in, reducing the need for constant internal status requests.
-
Good luck!
You must be a registered user to add a comment. If you've already registered, sign in. Otherwise, register and sign in.
Hi @Asif Khan ,
I would consider organizing this work into sprints. On the board, you will have better visibility - you will add only recent tickets and check statuses only for those per engineer. Or you can create a filter showing tickets created, for example, during the last week, apply this filter to the Filter Results gadget, add there the assignee column, and manage it there. Or you can create the Filter Result gadget per engineer.
As an alternative solution, you can use the app I developed - Multi-team Metrics & Retrospectives.
With it, you can compare multiple teams/boards, multiple engineers within these teams/boards and periods at once, while the periods might vary - sprints, months, quarters, half-years, or years. You can track any custom metric written using JQL. Here is an example:


Also, you can track dynamics in this way:

The app is free for Atlassian instances with up to 10 users.
Best regards,
Alexey
You must be a registered user to add a comment. If you've already registered, sign in. Otherwise, register and sign in.
Hi @Asif Khan
welcome to the community!
I understand the potential cost factor, but I'm not aware of this being available as a native functionality in Jira. Customers typically rely on apps from the Atlassian Marketplace for your use case.
If an app should become an option for you, you may want to have a look at the app that my team and I are working on: JXL for Jira.
JXL is a full-fledged spreadsheet/table view for your work items (issues) that allows viewing, inline-editing, sorting, and filtering by all your work item fields, much like you’d do in e.g. Excel, Google Sheets, Smartsheet, or Airtable. It also comes with a long list of advanced features, including support for (configurable) work item hierarchies, work item grouping by any work item field(s), sum-ups, or conditional formatting.
With these, you can build simple, inline-editable dashboards like e.g. this in just a couple of clicks:

This is really just one of a virtually endless number of possible views and reports; you can also view and group by any other issue fields, configure different sum-up styles, etc. etc. I'd need to understand your use case a bit better to advise on the perfect setup, but I'm sure we could save you and your team a substantial amount of time.
Any questions just let me know,
Best,
Hannes
You must be a registered user to add a comment. If you've already registered, sign in. Otherwise, register and sign in.
Thanks for all your response, I will go through it and let you know if I need any other help.
Note: We can utilize the free tool/gadget but management wouldnt allow to use any paid tool. So I will go though all the suggestions with the free tool and get back to you. Once again thanks for all your suggestions.
You must be a registered user to add a comment. If you've already registered, sign in. Otherwise, register and sign in.
Hey @Asif Khan
While Jira dashboards are powerful, they are often limited by the data they can display out of the box. A Marketplace app is usually the most direct solution for the kind of deep-dive reporting you're looking for.
Timepiece- Time in Status for Jira’s ‘'Assignee Duration’' report is great feature to track utilization and workload. It shows you exactly how much time each issue spends assigned to a specific user, giving you a clear report.

You can even create more advanced reports like Assignee Duration per Status to see how much time each team member is spending in specific stages of the workflow (e.g., 'In Progress' vs. 'Waiting for Review').

Crucially, any of these reports can be added to a Jira dashboard as a gadget. This directly addresses your request to create individual dashboards for your team leads, as you can configure each gadget to show the workload and efficiency for a specific team member.
.png")
And because Timepiece uses your existing Jira issue history, you can generate these reports for all past issues immediately after installation.
Hope my answer is helpful. Feel free to ask if you have any further questions. You can check Timepiece on the Atlassian Marketplace.
Disclosure: I'm on the team that makes Timepiece - Time in Status for Jira.
You must be a registered user to add a comment. If you've already registered, sign in. Otherwise, register and sign in.
Hi @Asif Khan ,
If you need time per person and where time is going (working vs waiting) without asking people to log work, this is where a reporting app helps (if you don't mind using a third-party apps).
I’m on the team that builds Time in Status. It reads work items change logs and shows:
-
Assignee Time – how long each person owned an issue while it was in “working” statuses (a clean proxy for effort/utilization).
-
Time in Status / Average Time – where work actually spends time (e.g., Waiting for Customer vs In Review).
.png")
-
Pivot view – roll up by Epic → Owning Team → Assignee so leads see per-client, per-team, per-person timing in one table.
-
Dashboard gadget & charts – surface “stuck items,” reopens, and monthly trends, etc.
.png")
.png")
You can also synchronize data from the app with Atlassian Analytics and build dashboards there based on time data in the status. In this article, I provide a more detailed explanation of how it works.

I hope it will be useful for you.
You must be a registered user to add a comment. If you've already registered, sign in. Otherwise, register and sign in.
Hi @Asif Khan,
Welcome to the Atlassian Community.
Creating a dashboard for each team member sounds like a good idea. But you can also create a single board, to be used by everyone.
If I understood correctly, all the work is tracked under the Epic ticket created by your customers, under various child tickets.
In this case, I think it would be useful to have on your dashboards a way visualize the epics along with their child issues and status.
Jira offers the Filter Results gadget, which can list the issues from a filter, but you could also try some of the gadgets offered by our Great Gadgets app.
Work Breakdown Structure (WBS) gadget lets you display the issues from a filer/JQL by their hierarchy: Epics > Task, Story > Sub-tasks along with their current status

Pivot Table & Pivot Chart gadget lets you display the Epic along with their tasks stats plus other fields, such as Status, Assignee, Team, etc

This gadget can also display the progress of epics, by number of tasks in each status or status category.


Team Wallboard Gadget - can display the issue from a filter / JQL in a Kanban board style - the columns being given by the status categories: To Do, In Progress and Done. It can group the issues by epics as in this example:

Regarding the efficiency of the people I would recommend the Time in Status gadget offered by the same app - it can display the total or average time in each workflow status or status category, by individual.

This app offers many other gadgets, and it accommodate many needs. Very useful can be Cumulative Flow Diagram gadget or WIP Run Chart gadget.
If you have questions or need any help, feel free to contact support@stonikbyte.com.
Danut.
You must be a registered user to add a comment. If you've already registered, sign in. Otherwise, register and sign in.
Hi @Asif Khan ,
Welcome to Atlassian community.
Based on my experience, your requirements are common and I think that you can implement using Jira dashboard with standard gadgets.
You should start creating filters, and then using some gadgets inside the dashboards.
For the individual dashboard, I would recommend divide ilthe dashboard in this sections:
- Items assigned to me in status "open"
- Items with expired due date
- Items expiring in next days
- Items where I'm working
It's better to create a unique individual dashboard for all the team, you can use the currentUser filter for it.
For monitoring the service, there are several gadgets you can implement. Usually it is compared #tickets opened, #tickets resolved, #tickets not resolved, with a date filter (last month, last year,...)
After this, if you require advanced reporting, you should go through marketplace.
I hope it helps
You must be a registered user to add a comment. If you've already registered, sign in. Otherwise, register and sign in.

You must be a registered user to add a comment. If you've already registered, sign in. Otherwise, register and sign in.