Community Announcements have moved! To stay up to date, please join the new Community Announcements group today. Learn more
×Community resources
Community resources
Community resources
How do I group users / assignees on a Dashboard by team, group or company / organization ?
Hi,
I have users/assignees in a project that come from multiple companies/organizations/Teams.
How do I group them by company / organization / team in charts e.g. a Pie Chart
Jira has no way of specifying the team, group or company that a particular user/assignee belongs to :( :(
3 answers

This depends entirely on what your report is for. Pie charts for example group by an issue field, not a users group, that's what they are built for.
What are you trying to report on here?
As i said in the post :
"I have users/assignees in a project that come from multiple companies/organizations/Teams.
How do I group them by company / organization / team in charts "
so obviously I want to show issues grouped by company, organisation or team.....
and Teams doesn't seem to be something Jira does at all...... i.e. the User object has NO team, department or organisation attributes that can be used :(
You must be a registered user to add a comment. If you've already registered, sign in. Otherwise, register and sign in.
It is now 1,5 year after Atlassian introduced Teams, and asked for some patience for having the option to use "teams" in the pie chart in Dashboards.
After 1,5 year it is still not possible. Come on Atlassian, what is this. I'm sick of need to use plug ins for standard functionalities in a "premium product", with a premium pricetag.
You must be a registered user to add a comment. If you've already registered, sign in. Otherwise, register and sign in.
Hi @Michael Green,
I am Marlene from codefortynine.
With our app Quick Filters for Jira Dashboards you can create advanced JQL filters, that enables you to filter "Quick Gadgets" on your dashboard for e.g. Teams (as you can see in the screenshot below.)
The JQL of the button "Team A" could have the JQL assignee in (Maria, Peter, Karen). But any other JQL is also possible.
I am afraid that's not 100% what you've been looking for, but if you want to learn more about our app, you can have a look at our public demo dashboards.
There might be also other Marketplace apps, that are interesting for you.

You must be a registered user to add a comment. If you've already registered, sign in. Otherwise, register and sign in.
The requirement was to show a pie chart of issues 'by team' ..... not filter down to issues within a specific team. I need to show for example there are 25 issues assigned to Team A, 10 to Team B, 5 to Team C etc
You must be a registered user to add a comment. If you've already registered, sign in. Otherwise, register and sign in.
Hi @Michael Green,
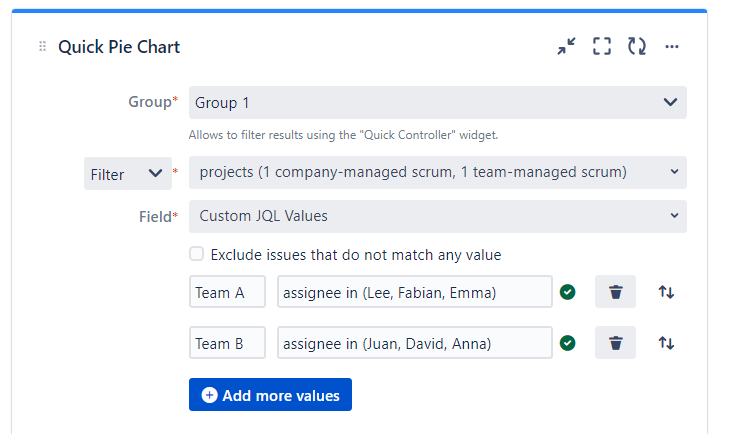
We've released an update for Quick Filters for Jira Dashboards which enables you to create Pie Charts from custom JQL values.
You have the ability to create a JQL query for each slice of a Pie Chart to specify the issues that should fall under that particular slice.
If you want to create a Pie Chart per teams, you could use the following JQL:
assignee in (Sam, Igor, Janine)
You can read more about the Quick Pie Chart gadget in our documentation.

You must be a registered user to add a comment. If you've already registered, sign in. Otherwise, register and sign in.

You must be a registered user to add a comment. If you've already registered, sign in. Otherwise, register and sign in.