Community resources
Community resources
Community resources
How is cycle time determined for story with "To Do" status?

In the Cumulative Flow Diagram, how is cycle time determined for stories with "To Do" status? Also, is this limited to stories assigned to sprints only (not unassigned stories in the backlog)?
3 answers
Hello @Elaine Collyer ,
The Cumulative Flow Diagram shows how many issues were in each status in the past. It doesn't help very much about Cycle Time. Could it be that you are referring to another report? Control Chart maybe?
EmreT
Welcome to the Atlassian Community!
For a comprehensive cycle time (cycle time starts when an issue is moved to “In Progress“ status and ends when the issue is moved to “Done” status) report, you can try Status Time Reports app developed by our team. For more detail, you can have a look at the article below.
Cycle Time and Lead Time in Jira: Productivity Measurement with Two Critical Parameters
Here is the online demo link, you can see it in action and try without installing the app. For further details, please see Status Time Reports How to Videos.
If you are looking for a free solution, you can try the limited version Status Time Free.
Hope it helps.
You must be a registered user to add a comment. If you've already registered, sign in. Otherwise, register and sign in.
Hi @Elaine Collyer,
If you want an effective way to measure cycle time, don't count on the limited and incomplete Jira reports. Take a look over our Great Gadgets app. It offers various gadgets for measuring and displaying cycle time, lead time or time between two statuses.
Cycle Time Trend - to see if and how your team improves in time

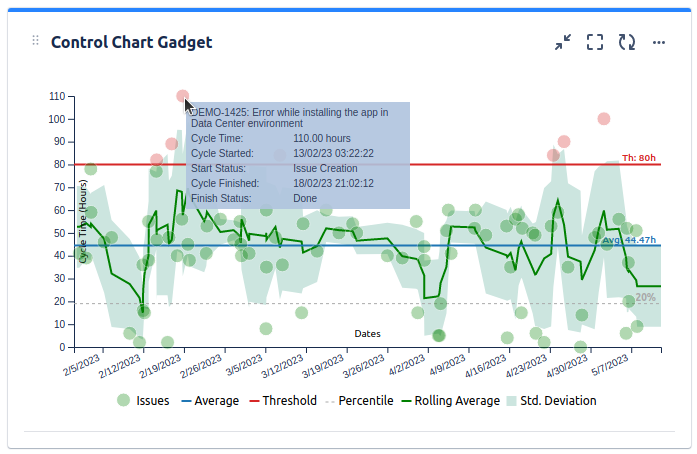
Cycle Time Control Chart - to see those issues that took longer than expected
Cycle Time Histogram - to see how many issues took longer than expected and see how many were in specific ranges

And you define what the "cycle time" is. For example: from "issue creation" to "Done", or from "In progress" to "Done".
To make a better idea over how many things you can track with our app, take a look over the articles from our blog.
I hope this helps.
Thank you,
Danut Manda
You must be a registered user to add a comment. If you've already registered, sign in. Otherwise, register and sign in.

You must be a registered user to add a comment. If you've already registered, sign in. Otherwise, register and sign in.