A pop-up survey could appear while you're here--curious what it's for? Click here to learn more!
×Community resources
Community resources
How to show number of status ticket on board to dashboard average time in status


4 answers

Hi @Yuliyani , welcome to the community.
I'm afraid this dashboard gadget does not have any option to display the total number of issues.
Hello @Yuliyani ,
Jira's own Average Age Chart, Resolution Time Chart and Control Chart offer very limited flexibility and details. For more, you should use a marketplace app built for this purpose.
If you are OK with using a marketplace app, our team at OBSS built Time in Status exactly for this and it is free for up to 10 users. The app is available for Jira Server, Cloud, and Data Center.
Time in Status mainly allows you to see how much time each issue spent on each status or each assignee.


You can combine the time for multiple statuses to get metrics like Issue Age, Cycle Time, Lead Time, Resolution Time etc.
For all numeric report types, you can calculate averages and sums of those durations grouped by the issue fields you select. For example total in-progress time per customer or average resolution time per sprint, week, month, issuetype, request type, etc. The ability to group by parts of dates (year, month, week, day, hour) or sprints is particularly useful here since it allows you to compare different time periods or see the trend.

The app calculates its reports using already existing Jira issue histories so when you install the app, you don't need to add anything to your issue workflows and you can get reports on your past issues as well. It supports both Company Managed and Team Managed projects for Jira Cloud.
Time in Status reports can be accessed through its own reporting page, dashboard gadgets, and issue view screen tabs. All these options can provide both calculated data tables and charts.


https://marketplace.atlassian.com/apps/1211756/
EmreT
You must be a registered user to add a comment. If you've already registered, sign in. Otherwise, register and sign in.
Hi @Yuliyani ,
Try using the app from my team, Time in Status for Jira. Using the gadget, you can display a list of tasks and a report chart on the dashboard: Time in Status, Average time in status, Status count, etc.
Here is detailed information about the gadget's capabilities - Documentation.

You must be a registered user to add a comment. If you've already registered, sign in. Otherwise, register and sign in.
Hi @Yuliyani,
I think that this can be done by using the WIP Aging Chart gadget offered by our Great Gadgets app. This app is free for up-to 10 users.
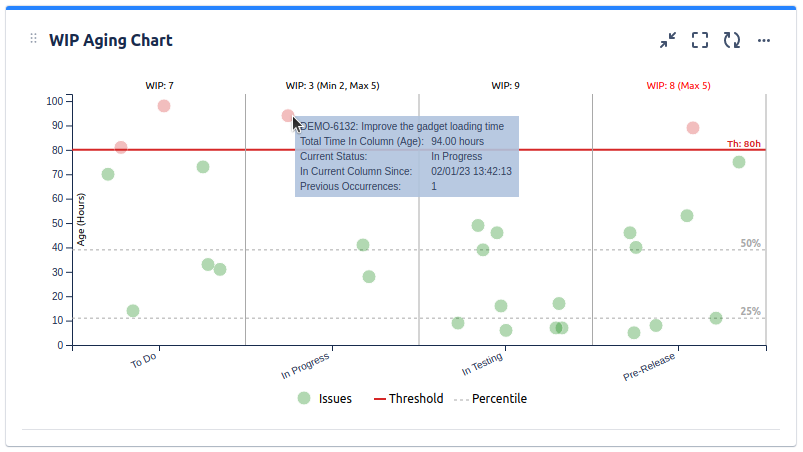
This gadget displays the columns or statuses of a selected agile board, and their issues by their age (time in that status/column). On top of each column you have the WIP (total issues in that status / column) and the WIP limits (if set).
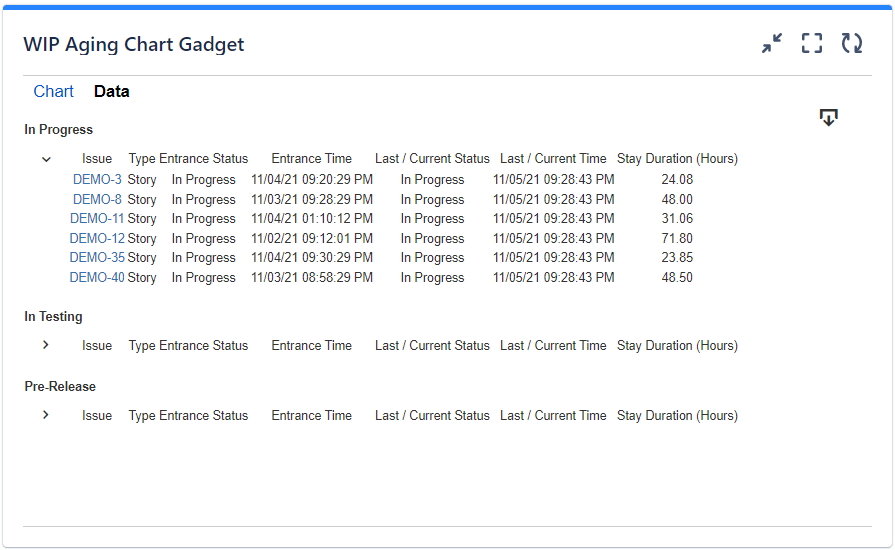
The gadget can also offer a Data tab with detailed info about the issues, which you can easily export in CSV.
Be aware that this app offers many other gadgets that you can find useful. Just have a look over the articles from our blog to see how many things you can track with this app.
I hope this helps.
Thank you,
Danut Manda
You must be a registered user to add a comment. If you've already registered, sign in. Otherwise, register and sign in.

You must be a registered user to add a comment. If you've already registered, sign in. Otherwise, register and sign in.