Community resources
Community resources
Project Reporting to Management

Management wants to have a single document that lists all the projects and on each project
1. What has been done on the project so far
2. What we are working on this week
3. What's left to be done
4. Any red flags.
5. Color-code the project based on project status, like green, yellow, red
Currently, we cut and paste things into Confluence and also write out the red flags, etc. We are trying to see if there is an automated way of doing this or if there are any third-party tools that help.
I see I can use JQL to create lists, but where in JIRA you will put the red flags that are common to the entire project, and not just a task.
4 answers
Hi, @Jay Janarthanan
If you consider Marketplace solutions - you can cover most of this without manual copy/paste using Report Hub’s Roll-up Table Report. It’s built for exactly this kind of management overview.
-
What’s been done so far → The report rolls up work automatically (Epic → Story → Sub-task). Progress bars and completed items contribute to the parent totals, so you can see at a glance how much has already been delivered.
-
What we’re working on this week → You can filter the report with JQL or saved filters. For example, “updated during the last 7 days” or “Sprint = currentSprint()” will show only this week’s activity.
-
What’s left to be done → Open issues stay visible in the hierarchy, and rollable fields (like Story Points or Original Estimates) give you the totals of remaining work at every level.
-
Color-coded status → The built-in progress bar works great as a quick traffic-light view. Since it rolls up child progress, management can instantly see which projects are on track (green), in progress (yellow), or falling behind (red).

The nice part is that this isn’t a static Confluence table, it’s always live. You can expand/collapse rows, sort, customize columns, and click through directly to the Jira issues if needed. Basically, it gives management the “single document” they want, but fully automated and always up to date.
Hi @Jay Janarthanan
For I see I can use JQL to create lists, but where in JIRA you will put the red flags that are common to the entire project, and not just a task.
You can add in a new work item type, e.g. 'Project Overview'
Then set up the fields on that for Red Flags, RAG Status, etc.
Use a JQL filter such as on your Confluence page:
Project = "MyProject" AND type = "Project Overview"
You will just have to create one Project Overview ticket per Project
And automation can be used to automate notifications / emails any time the RAG Status changes.
You could also use Projects under Home (https://www.atlassian.com/platform/platform-apps/projects) and use the inbuilt functionality there to automate communications and reporting
You must be a registered user to add a comment. If you've already registered, sign in. Otherwise, register and sign in.
Hi @Jay Janarthanan,
Welcome to the Atlassian Community.
For a “single document” report, my advice is to create a Jira dashboard or, even better, a Confluence page with all the necessary gadgets/macros that provide this information in real time. While both approaches allow you to centralize all the information in one place and support customization, the Confluence page has the advantage of allowing you to enter your own notes, conclusions, etc. in the form of free text that accompanies the graphs. You're already using Confluence pages, so you're on the right track :)
Now, to automate your report, and to avoid copy-pasting, you need to embed the right macros in your Confluence page that reads projects data from Jira and display it in the way you want. Confluence offers some good macros for this such as Jira Work Items macro or Jira Charts macro (which includes Pie Chart and Two Dimensional Filters Statistics).
If you need more macros, you can search for a plugin on Atlassian Marketplace. In case you want to try an plugin, our Great Gadgets for Confluence Cloud app offers many useful macros for this purpose.
Here are some examples that you could explore:
Pivot Table & Pivot Chart gadget/macro - can provide an overall projects completion in form of a table, heatmap table or charts of various types, based on count of issues, sum of story points, etc


Team Wallboard gadget/macro - can display the issues from a filter/JQL and display them in form of a Kanban board by status categories. It supports swimlanes by project. You could use this to display what has been done so far, what's left and what the team is working on (requirements 1, 2 and 3) in each project. The card color can be customized.

Issue Filter Formula gadget/macro and Advanced Issue Filter Formula gadget/macro - let you calculate and display project key numbers (count, sum of fields, percentages, any math formula combining data from multiple filters). You can choose to color the numbers depending on their value. So this way you could display red/yellow/green flags automatically.

It can be also configured as a gauge chart with configurable colors and value ranges:

Hope this helps. If you need any help with our macros/gadgets feel free to contact us at support@stonikbyte.com.
Danut.
You must be a registered user to add a comment. If you've already registered, sign in. Otherwise, register and sign in.
It's great that you're looking for a more automated and streamlined way to generate your project status reports. Manually cutting and pasting into Confluence can be time-consuming, and there are definitely better approaches within the Atlassian ecosystem.
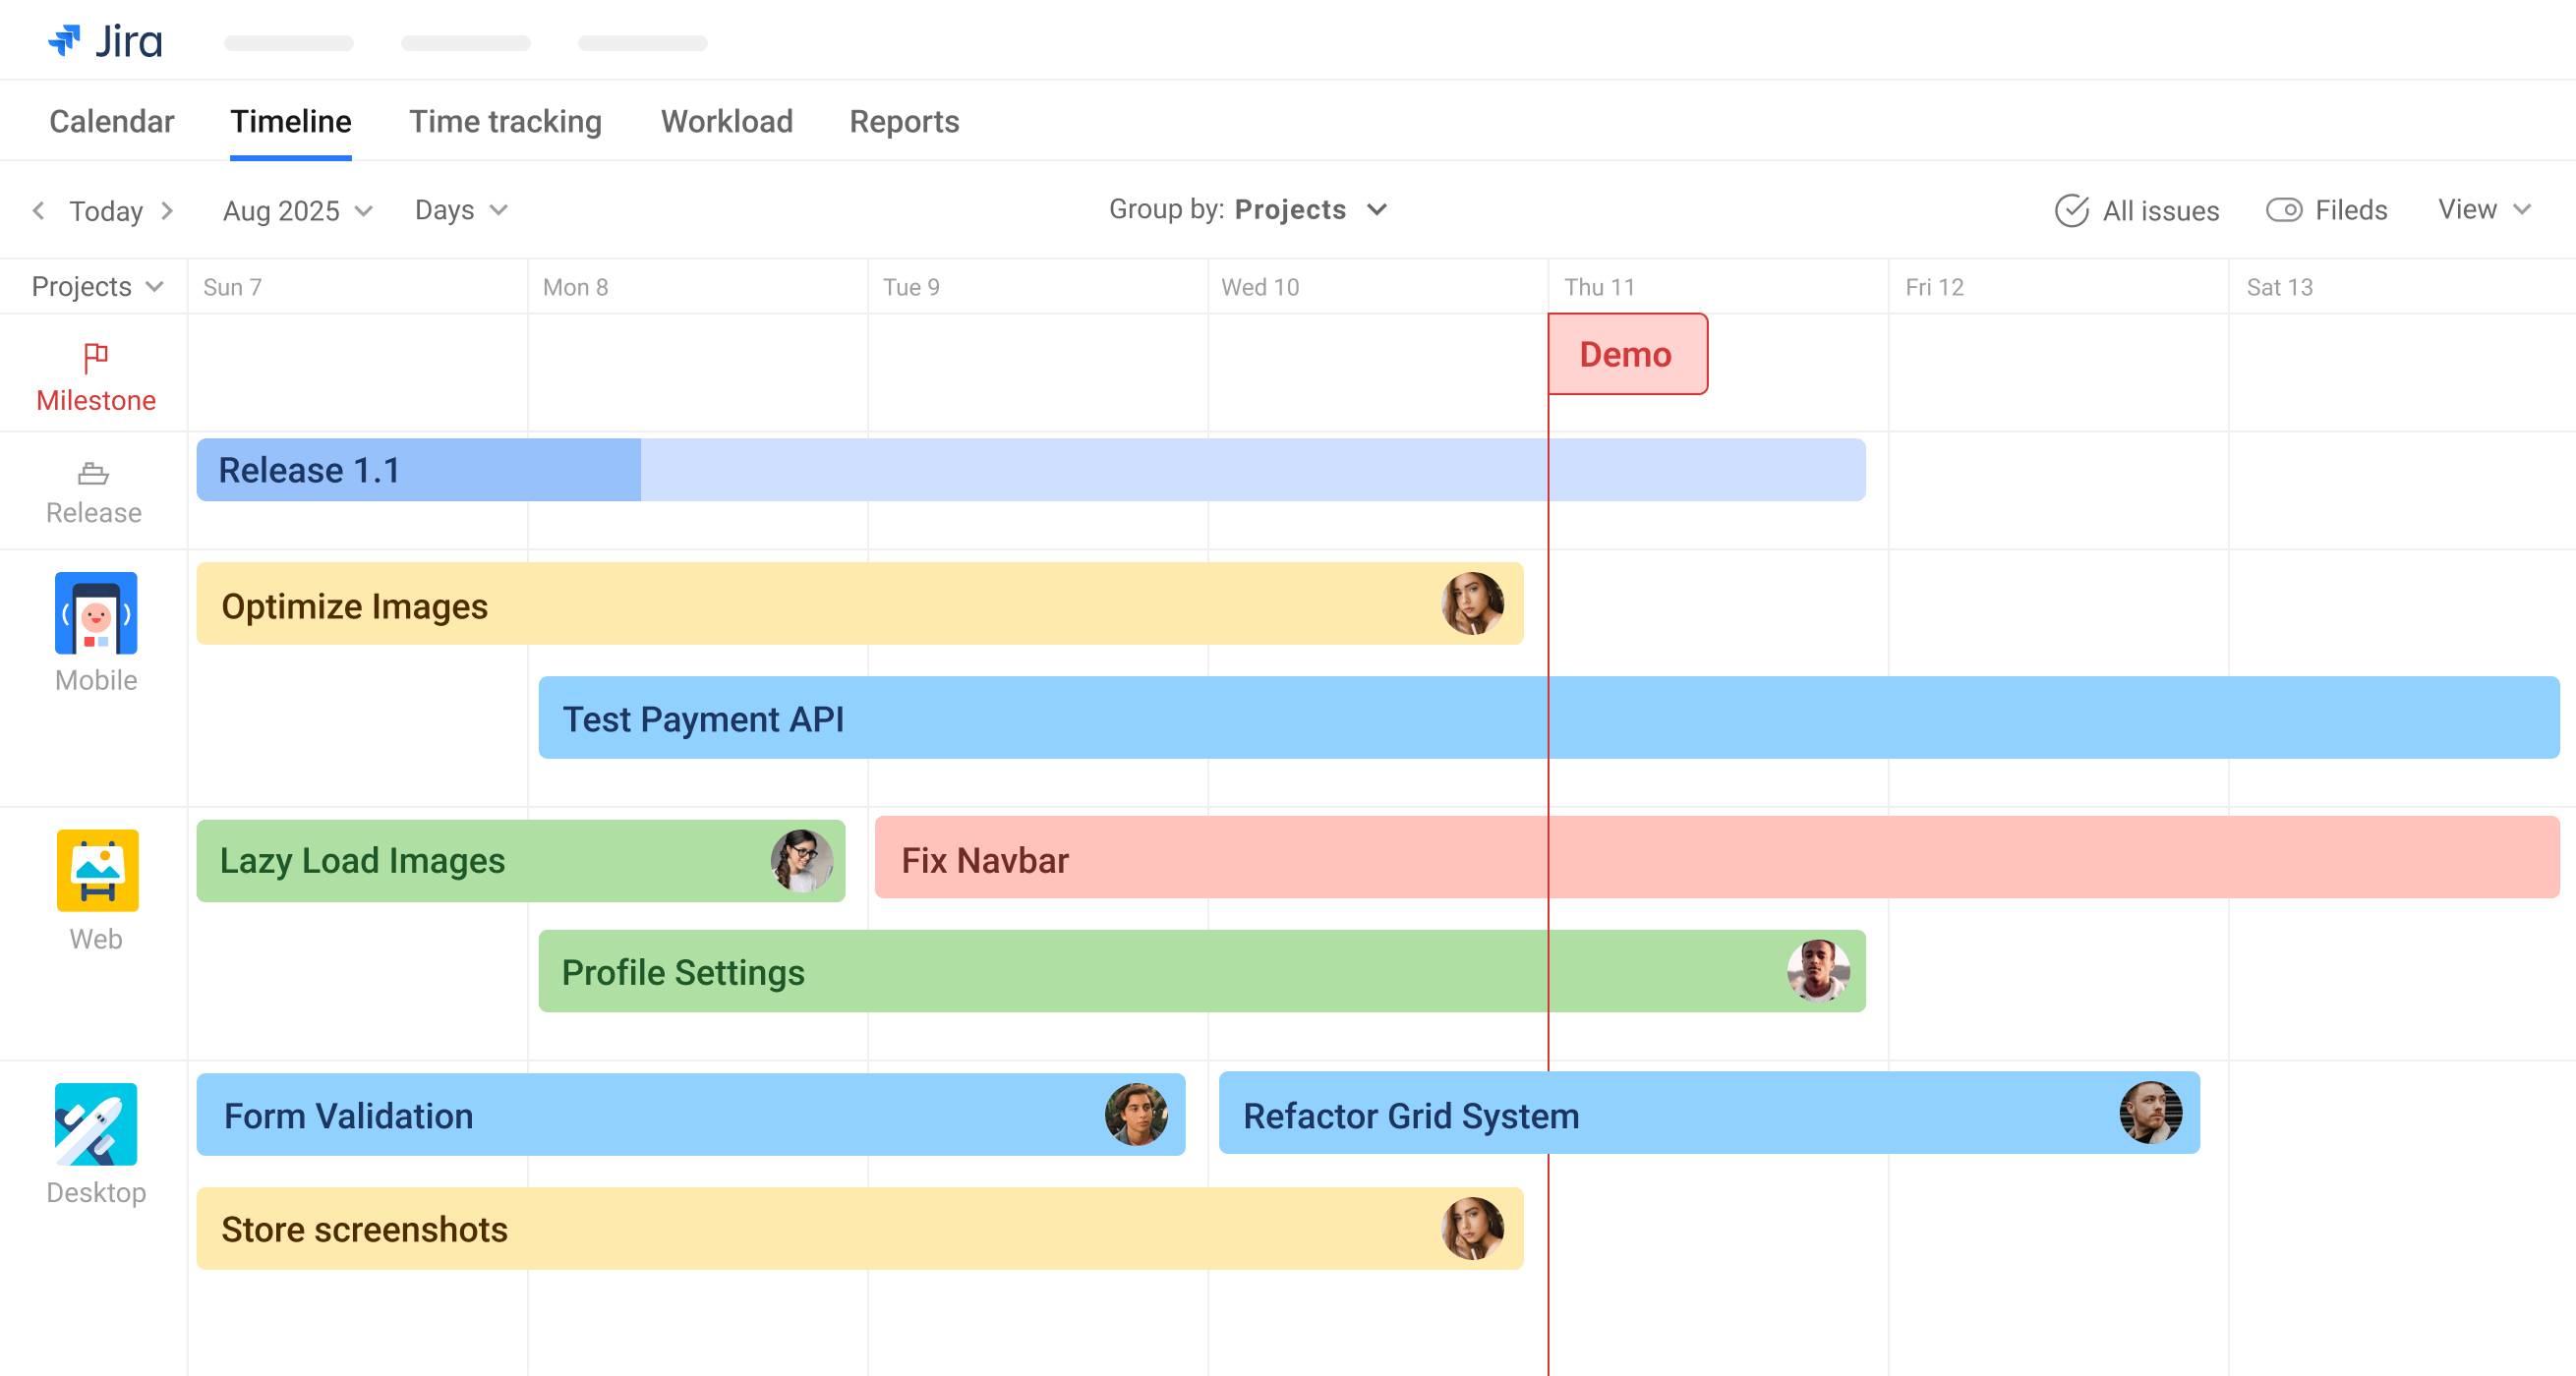
For your primary need of a single document that lists all projects on a timeline, I highly recommend Planyway. It's a powerful third-party app for Jira that excels at creating cross-project timelines grouped by projects, users, teams, epics, or components. This will give your management the high-level visual overview they are looking for.
Also, you can achieve your specific reporting requirements with JQL filters:
1. What has been done on the project so far?
You can use Jira's JQL (Jira Query Language) to create filters that show completed work for each project. A simple JQL query for this would be:
project = "Your Project Key" AND status = "Done"
You can then use the "Filter Results" gadget on a Jira dashboard to display these completed issues for each project.
2. What we are working on this week
Similarly, you can use JQL to identify issues that are currently in progress. This can be defined by status and when the issue was last updated. A sample JQL query could be:
project = "Your Project Key" AND status = "In Progress" AND updated >= -7d
This will show you issues that are in the "In Progress" status and have been updated in the last 7 days. Again, the "Filter Results" gadget on a dashboard is a great way to visualize this.
3. What's left to be done
To see the remaining work, you can create a JQL filter for all unresolved issues in a project:
project = "Your Project Key" AND resolution = Unresolved
This will give you a clear list of all the work that is yet to be completed. A pie chart gadget on a dashboard can be effective here to show the proportion of remaining work by assignee or issue type.
4. Any red flags and 5. Color-code the project based on project status
This is a common requirement that Jira doesn't handle out-of-the-box at a project level. While you can flag individual issues, a project-wide red flag or status requires a bit of a workaround or a specialized app.
Here are a couple of excellent options:
- Use a Third-Party App for RAG Status: I would recommend looking into an app like Suri - Project RAG Status for Jira Reporting. These apps are specifically designed to add a Red-Amber-Green (RAG) status to your Jira projects. This allows you to set a "health" status for each project, which is exactly what you're looking for with "red flags." These apps often provide their own dashboards and gadgets to visualize the status of all your projects in one place.
- Create a Custom Field: You can create a custom "Select List (single choice)" field in Jira called "Project Health" or "Project Status" with the options "Green," "Yellow," and "Red." To make it more visual, you can even use Unicode characters like 🟢, 🟡, and 🔴 as the options. While you would need to manually update this field for each project, it gives you a way to track the overall status.
Putting it all together in a "Single Document":
Instead of a static Confluence page, you can create a comprehensive Jira Dashboard. This dashboard would have:
- A Planyway app to display the cross-project timeline.
- "Filter Results" gadgets for each project, using the JQL queries mentioned above to show what's done, in progress, and left to do.
- A gadget from your RAG status app (like Suri) to show the color-coded project health.
This dashboard becomes your dynamic, single source of truth that is always up-to-date, eliminating the need for manual copy-pasting.
You must be a registered user to add a comment. If you've already registered, sign in. Otherwise, register and sign in.

You must be a registered user to add a comment. If you've already registered, sign in. Otherwise, register and sign in.