Community resources
Community resources
SLA and Time Tracking Across Swimlanes in Jira Software
I have a Jira Software board (not Jira Service Management) with multiple swimlanes based on statuses such as:
-
To Do
-
Dev In Progress
-
Dev Done
-
QA In Progress
-
QA Done
-
PO Accepted
-
On Hold
Our company has internal SLAs, and I’d like to track the start and end date/time for each ticket in each status in order to calculate:
-
The time spent in each lane/status
-
The total turnaround time (TAT) for each ticket
-
The overall SLA compliance
-
If possible, the time to first response (i.e., the time between ticket creation and the first activity or status change)
I know these features are available in Jira Service Management through SLA tracking and automation.
My questions are:
-
Can we achieve similar SLA/time tracking within Jira Software (standard Jira)?
-
Can issue history logs be used effectively for calculating time spent in each status?
-
Are there any recommended native features, plugins, or automation rules that can help track and report these metrics?
8 answers
Hello @Raunak Maskay
There is no built-in SLA feature in regular Jira – SLA metrics like response and resolution time tracking are only available in Jira Service Management.
However, with Timepiece - Time in Status for Jira, developed by our team at OBSS, you can bring SLA-like tracking into any Jira project.
Using the Status Duration Report, you can measure exactly how long each issue spends in each status , such as:
-
To Do
-
Dev In Progress
-
Dev Done
-
QA In Progress
-
QA Done
-
PO Accepted
-
On Hold
This makes it easy to calculate metrics like:
-
Time spent in each lane/status
-
Total turnaround & cycle time , by summing selected statuses
-
First response time by tracking time in To Do before the first transition
You can also use Consolidated Columns to group statuses into SLA metrics like "Response Time" or "Resolution Time", and monitor them across all issues.


To make SLA breaches more visible, you can use the Highlight feature to define visual thresholds such as:
- Resolution Time ≥ 10 days
- Resolution Time ≥ 7 days
- Response Time ≥ 2 days
You can also apply a working calendar to exclude weekends and non-working hours — essential for accurate SLA tracking.
If you'd like to explore this solution further, feel free to check out Timepiece - Time in Status for Jira on the Atlassian Marketplace.
Hope it helps!
Ayça
Hi @Raunak Maskay 👋
You’ve laid out a very clear and practical goal — tracking time spent in each swimlane/status, turnaround time, and SLA compliance in Jira Software.
Let’s break it down by your questions:
1. Can you track SLA/time data in Jira Software (Standard Jira)?
Yes, but it requires workarounds — since Jira Software doesn’t have built-in SLA tracking like Jira Service Management.
You can:
-
Use the Control Chart to analyze Cycle Time (but not per status)
-
Use Automation Rules to capture time data in custom fields (though this becomes complex to maintain)
2. Can issue history logs help calculate time in each status?
Technically, yes — using the changelog in each issue, you can extract:
-
Transition timestamps
-
From → To statuses
-
Assignee changes, etc.
But this is manual or requires scripting via the Jira REST API, and it’s hard to scale across projects and sprints.
3. Solution: Time Metrics Tracker | Time Between Statuses
This app gives you exactly what you’re looking for — without needing JSM, scripting, or heavy automation.
With Time Metrics Tracker, you can:
- Create any Custom Time Metrics
-
Automatically calculate time spent in each status per issue
-
Set up custom metrics like TAT, Lead Time, Time to First Response, or Time between “To Do” → “PO Accepted”
-
Filter by assignee, project, sprint, or date range
-
Visualize reports in Dashboards or export to Excel for deeper SLA tracking
App developed by my team, so we’re always happy to help 🚀
You must be a registered user to add a comment. If you've already registered, sign in. Otherwise, register and sign in.

You can try third party plugin 'Time to SLA' https://marketplace.atlassian.com/apps/1211843/time-to-sla?hosting=cloud&tab=overview
Regards,
Ashish
You must be a registered user to add a comment. If you've already registered, sign in. Otherwise, register and sign in.
Hi @Raunak Maskay
We had a similar challenge in our team with internal SLAs inside Jira Software (not JSM).
You might want to try the Issue Delivery Report app it’s a lightweight tool that shows:
-
Time spent in each status
-
Total turnaround time
-
Flow Efficiency
-
Late sprint additions and warnings if flow is inefficient
It runs directly in the Jira issue view and uses full changelog to calculate timing, so no custom fields or automation required.

Here's the link if you'd like to try it:
🔗 https://marketplace.atlassian.com/apps/1238016
I hope this message is useful and will help you!
You must be a registered user to add a comment. If you've already registered, sign in. Otherwise, register and sign in.
You can build your own custom solution to read issue change log data using Jira API's to get this information.
Another option would be to try out a mktplace app like ours below.
With this app you generate time in each workflow status for multiple issues with multiple filter and grouping options. The app has 20+ reports to meet a variety of use cases. Some of the app reports which can be generated are :
- time in status for Jira issues
- how long colleagues have been assigned to issues
- average time issue has been spent in each state
- date of issue entry into a status
- transition and status count for each issue
- Group your statuses to define your own Cycle/Lead times
Disclaimer : I am part of the app team for this add-on

You must be a registered user to add a comment. If you've already registered, sign in. Otherwise, register and sign in.
Jira doesn't have a built-in solution for the reports you need. The raw data you need is available in issue history and you can get it using Jira Rest API. It provides status changes for each issue by returning a json which you need to parse.
If you prefer using a marketplace app, you can try Status Time Reports app developed by our team. It mainly provides reports and gadgets based on how much time passed in each status.
This app has a dynamic status grouping feature so that you can generate various valuable reports as time in status, time in assignee, status entry dates and status counts, cycle time and lead time, resolution time, average/sum reports by any field(e.g. average in progress time by project, average cycle time by issue creation month).
Here is the online demo link, you can see it in action and try without installing the app. For further details, you can have a look at Status Time Reports How to Videos.
App Features:
- You can search issues by Project, Issue Type, Status, Assignee, Issue Creation/Resolution Date(and any other Date field) and JQL Query.
- Status durations are calculated according to the working calendar you define. Once you enter your working calendar into the app, it takes your working schedule into account too. That is, "In Progress" time of an issue opened on Friday at 5 PM and closed on Monday at 9 AM, will be a few hours rather than 3 days.
- You can set different duration formats.
- You can export reports in CSV file format and open them in MS Excel.
- You can also add this app as a gadget to your Jira dashboards and reach “Status Time” from Issue Detail page.
- You can enable/disable access to Status Time reports&gadgets and Issue Detail page per project, users, groups or project role.
If you are looking for a completely free solution, you can try the limited version Status Time Reports Free.
If you have any questions, feel free to schedule a call with us.
Hope it helps.
You must be a registered user to add a comment. If you've already registered, sign in. Otherwise, register and sign in.
Hi @Raunak Maskay,
Technically, it is possible to get the historical logs and use them to calculate the time spent in each status. This could be done pragmatically via a script or your own app, using Jira REST API endpoints to retrieve the data and then implementing your own logic to perform the calculations. But this is complicated, requires a lot of effort, and is prone to errors.
My advice is to search on Atlassian Marketplace for a plugin that does this type of calculations. In case you want to try an app, our Great Gadgets app offers some gadgets that will fully address your needs with minimal effort:
Time in Status gadget - allows you to visualize the (total or average) time in status for the issues in a filter/JQL.

The gadget displays a Data tab with detailed info for every issue.

So this will gadget will cover your "time spent in each lane/status" requirement.
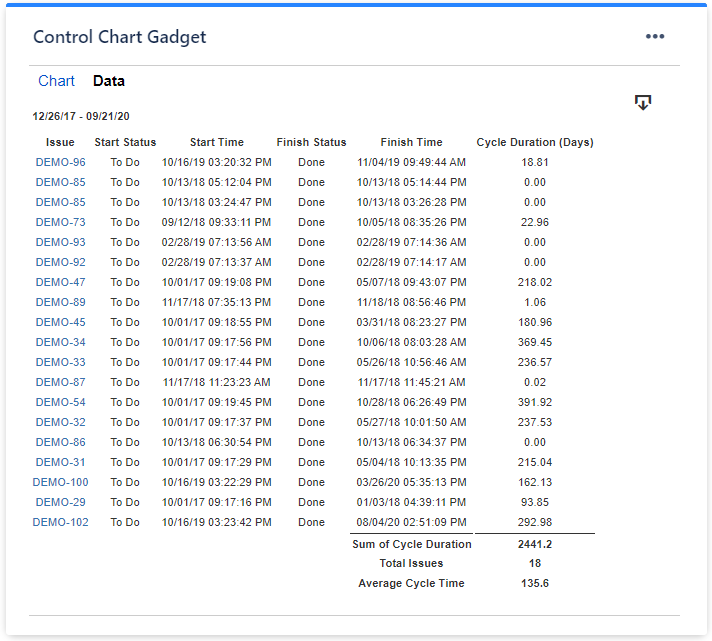
Control Chart gadget - This gadget displays the issues from a filter by their cycle time (time since the issue creation or entrance in a certain status or status category A, until entrance in a different workflow status or status category B).

It allows you to set a threshold (the red line) that represents your SLA and it will highlight the issues that breached the SLA (in red color).
With the Histogram Chart gadget you can see the cycle time distribution and see how many issues breached their SLA.

With Cycle Time Trend gadget you can track the cycle time for your team along the time and see the trend along with the average.

And these gadgets offer also a Data tab with a detailed report about the issues and their SLA, which you can easily export in CSV.
These gadgets will help you with "time to first response", "overall SLA compliance" and "total turnaround time (TAT)".
See also this article: https://community.atlassian.com/forums/App-Central-articles/An-effective-dashboard-for-Service-Desk-and-Customer-Support/ba-p/2360369
If you have questions or need any help, feel free to contact us at support@stonikbyte.com.
Danut.
You must be a registered user to add a comment. If you've already registered, sign in. Otherwise, register and sign in.
Unfortunately, you can't achieve them out of the box. You have to use an app from the Marketplace. Time to SLA seems to be the best on the market, as it allows you to define and report complex SLAs not only for JSM but also for software projects.
The issue changelog tracks every status change with a timestamp, so you can compute them. However, if you need more complex data (according to the working calendar, holidays, etc.), I'd suggest (again) using an app for this purpose as well.
SnapMetrics - Real Time Analytics free app comes with reports, including Time by Status, Time by Assignee, KPI Metrics, Issue History, and Worklog Reports. For the metrics, you can define any metric, including Time in status, time entered/exited status(es), and who transitioned the issue to any status(es), etc.
Please bear in mind that I was one of the folks behind Time to SLA (the creator) and also I am one of the folks behind SnapMetrics :)
You must be a registered user to add a comment. If you've already registered, sign in. Otherwise, register and sign in.

You must be a registered user to add a comment. If you've already registered, sign in. Otherwise, register and sign in.