Community resources
Community resources
how to know your team capacity for better planning?
I work by the Kanban method. I want to know my team's capacity to know which workload we can handle. The agile coach in the company suggested that we make a task estimate as T-shirt sizes (S/M/L) and assign each task to a size according to how long it takes a senior to finish it. And use this as a measuring unit for our team capacity. Any thoughts?
5 answers
I would use Story points rather than T-shirt estimates - because you can easlily add up the story points you complete each week - which you cant do easily with T-shirt estimates.
The problem with T-shirt estimates is that in one sprint you might complete
- Four stories - S, S, S, S
- Next sprint you complete two stories but of different sizes - M, L
Then when you are planning your work you can't really tell how much you willl complete - as you can't easily add 4x S and M+L and compare with what you have in your backlog. Story points help here because you can add up the numbers - and you have a single number which is your velocity. (Check out the section - How is your velocity calculated - in this article: https://smartguess.is/blog/what-is-agile-velocity
To answer your question - how to know your team capacity - then your teams velocity is exactly what you are looking for. It answers how much work you complete in a given sprint / week / two weeks or whatever timeframe you use.
The article above explains velocity and how to use it to answer related questions such as:
- When you can deliver a feature?
- What can you deliver before the end of next week, month, quarter?
Notice the blog post above is a part of a series that goes step by step and explains the key concepts and how to set everything up in jira to start using Story Points or T-Shirt estimates.
Regarding to "assign each task to a size according to how long it takes a senior to finish it." This is not a recommended practice. The purpose of relative estimation is to move away from asking:
- 'how long will it take 'me' to implement this story?' - people with different experiences will take less / more time depending on their skills and experice level.
So instead with relative estimates the team asks:
- Is this story smaller, same size or bigger than other X point story I have in the backlog?
Here is a article that talks about this: https://smartguess.is/blog/why-storypoints-and-not-hours/
Hope it helps!
Björn Brynjar
Ps Was teaching these methods in the University for years - so let me know if you have any other related questions 🤓
Hi @Björn Brynjar - Smart Guess , not sure that in this case it applies the sprints approach. We should know if more detail about the team, method of work and so on.
Sara starts telling that works with Kannan.
You must be a registered user to add a comment. If you've already registered, sign in. Otherwise, register and sign in.
Hi there @Matteo Vecchiato
I am sorry, but I am not sure I understand what you mean. Relative estimates (T-shirt, story points, other estimation or forecasting methods) are not limited to teams running sprints.
Sara and her team are using Kanban and can use any method they find works well for them to determine their capacity. They will need to define a timebox as you correctly pointed out, to determine capacity in relation to time.
I expect Sara will read through the answers and decide on the best approach after adding all the details that matters from the context around her team.
I am just trying to help.
You must be a registered user to add a comment. If you've already registered, sign in. Otherwise, register and sign in.
Hi @Sara Yasser ,
I find Scrum helps assess team capacity more accurately and enables more predictable planning, since teams plan based on their velocity and avoid overcommitting beyond it. Would you be open to trying Scrum?
In Kanban, you can achieve something similar by defining the team’s throughput (the number of stories completed within a given cycle). To make this effective, it’s important that stories are relatively comparable in size, or, if not, to at least classify them as L, M, or S. I don’t believe relying solely on estimates from senior team members is accurate, since junior members may need more time. Their contributions and perspectives should also be factored in.
You must be a registered user to add a comment. If you've already registered, sign in. Otherwise, register and sign in.
Hello @Sara Yasser
While T-shirt sizing is a good way to start conversations about effort, for Kanban capacity planning, a more direct approach is to use your team's historic performance data. This shifts planning from guesswork to forecasting based on facts.
You can focus on 2 metrics:
Throughput: How many work items does your team complete per week?
Cycle Time: How long does an item take from "In Progress" to "Done"? Cycle Time helps you predict future delivery times.
With this info, you'll see a reliable range, like "Our team typically completes 5-8 items per week." That's your true, data-driven capacity.
The key is having accurate data, but this can be tricky in Jira as default reports often include non-working hours, weekends, etc. This can misinterpret your metrics. If you are open to using a Marketplace app, I can recommend Timepiece - Time in Status for Jira. Timepiece uses your existing issue history to provide accurate reports immediately after installation, with custom calendars to exclude non-working hours for a true measure of your team's efficiency.

By measuring your actual flow, you can build predictable plans based on what your team truly accomplishes. Hope that helps.
Disclaimer: I am a part of OBSS, developer of Timepiece.
You must be a registered user to add a comment. If you've already registered, sign in. Otherwise, register and sign in.
Hi Sara,
In the report you build it is important the time basis (tipically a week, 2-week, month).
To set the sizes, I would recommend the comparison method comparing work items with a "well-known standard S-size task" without comparing to the time a senior needs to complete the task. Your team is not composed by only seniors, it's better to adjust to a medium profile.
Regards
You must be a registered user to add a comment. If you've already registered, sign in. Otherwise, register and sign in.

Hi Sara,
Using T-shirt sizes (S/M/L) to estimate tasks is a smart way to measure your team’s capacity in Kanban. It helps you understand how much work your team can handle by sizing tasks based on how long they typically take.
Try sizing tasks together as a team, then track how many sizes you complete each week to get a sense of your capacity. Adjust as you learn over time. This keeps planning simple and flexible.
Hope this helps! Let me know if you want more tips.
You must be a registered user to add a comment. If you've already registered, sign in. Otherwise, register and sign in.
Hi @Sara Yasser
Your agile coach's suggestion to employ T-shirt sizing (S/M/L) for task estimation is a widely recognized and effective agile practice for gauging the relative effort of work items.
While T-shirt sizing provides a valuable estimation framework, a tool like Planyway is instrumental in visualizing and managing your team's capacity based on these estimates. Planyway integrates with tools like Jira and Trello to offer enhanced resource and workload management capabilities.
Here's how you can combine T-shirt sizing with Planyway for effective Kanban capacity planning:
1. Translate T-Shirt Sizes into a Numerical Value
Planyway's workload view often relies on a numerical value, such as story points or hours, to calculate and visualize team capacity. To bridge the gap between the abstract T-shirt sizes and Planyway's calculations, you'll need to establish a simple numerical equivalent for each size. For example:
- S = 2 story points
- M = 5 story points
- L = 8 story points
- XL = 13 story points
2. Configure Your Tool to Capture Estimates
In your project management tool (like Jira), you can use a custom field to assign the T-shirt size and another field (like "Story Points" in Jira) to hold the corresponding numerical value. This ensures both the relative estimate and the value for capacity planning are captured.
3. Visualize Workload with Planyway
Once your tasks are estimated and assigned, Planyway's workload view provides a clear visualization of each team member's capacity. You can see who is underloaded, at capacity, or overallocated based on the story points assigned to their tasks for a given period.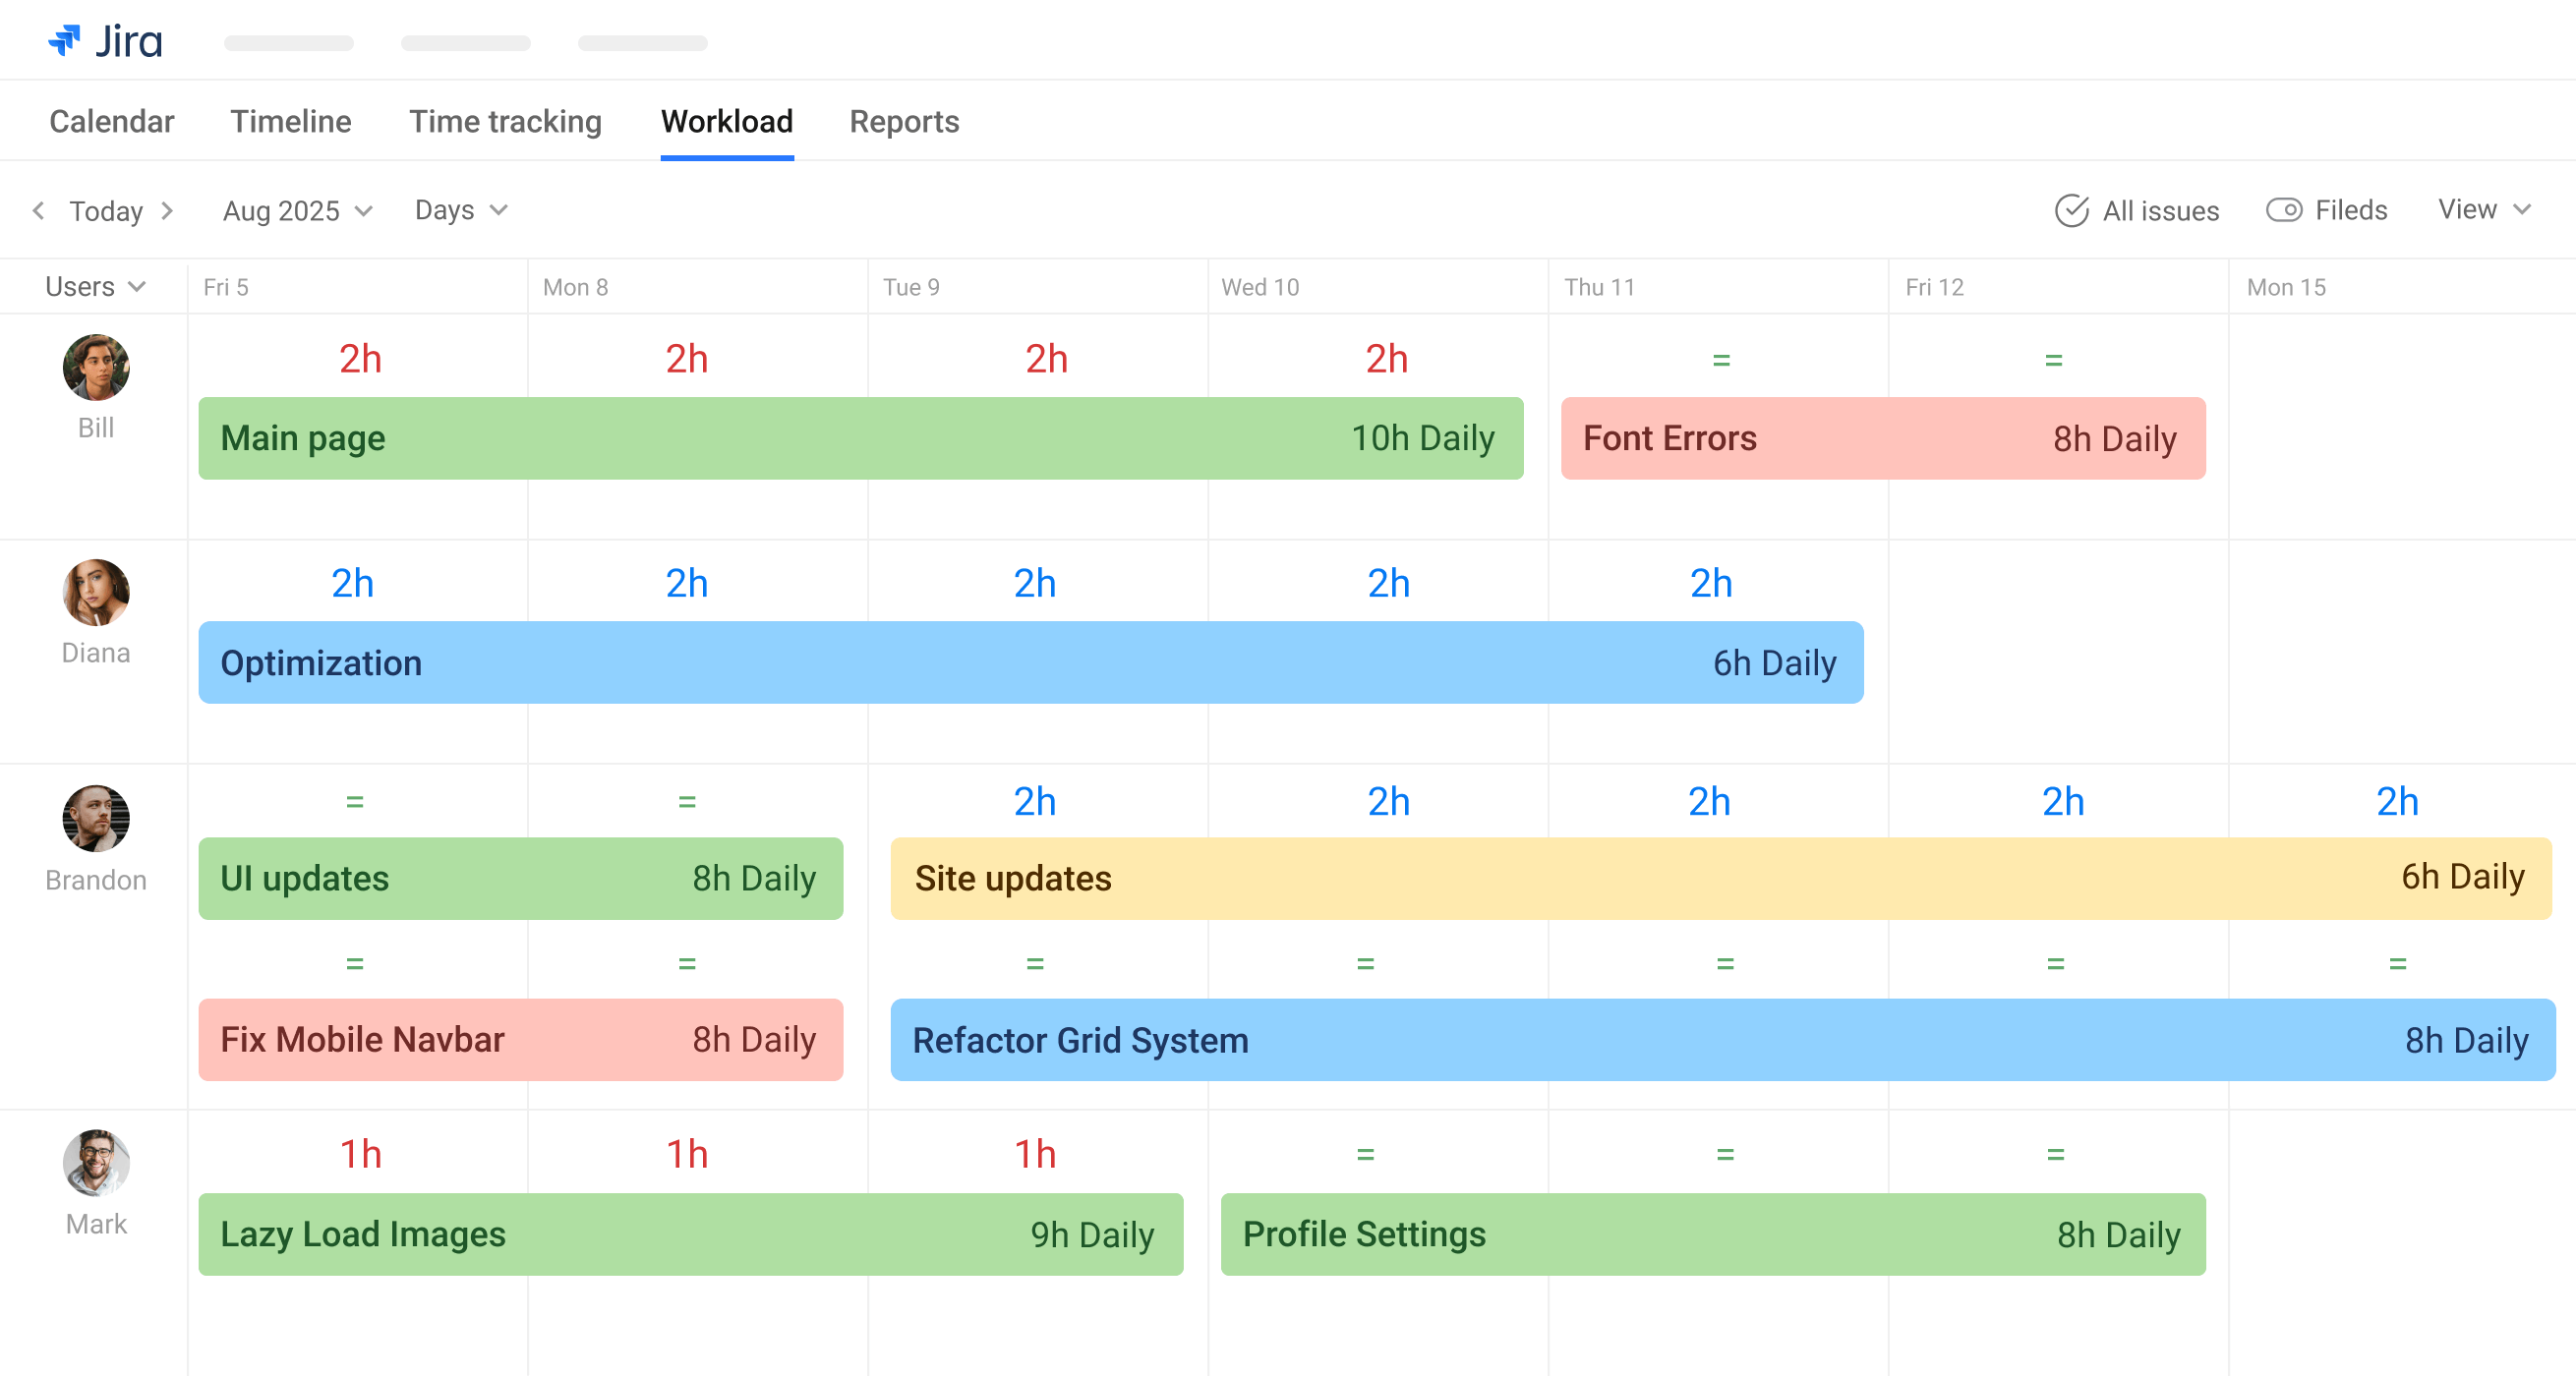
4. Monitor and Adjust
By consistently using this approach, you can gather data on your team's velocity – the number of story points (or a mix of T-shirt sizes) they typically complete. This historical data, combined with Planyway's visualizations, allows you to more accurately forecast your team's capacity for future work and identify potential bottlenecks before they become critical.
You must be a registered user to add a comment. If you've already registered, sign in. Otherwise, register and sign in.

You must be a registered user to add a comment. If you've already registered, sign in. Otherwise, register and sign in.