Community resources
Community resources
- Community
- Products
- Sourcetree
- Questions
- Why does the graph in sourcetree look so different from git log?
Why does the graph in sourcetree look so different from git log?
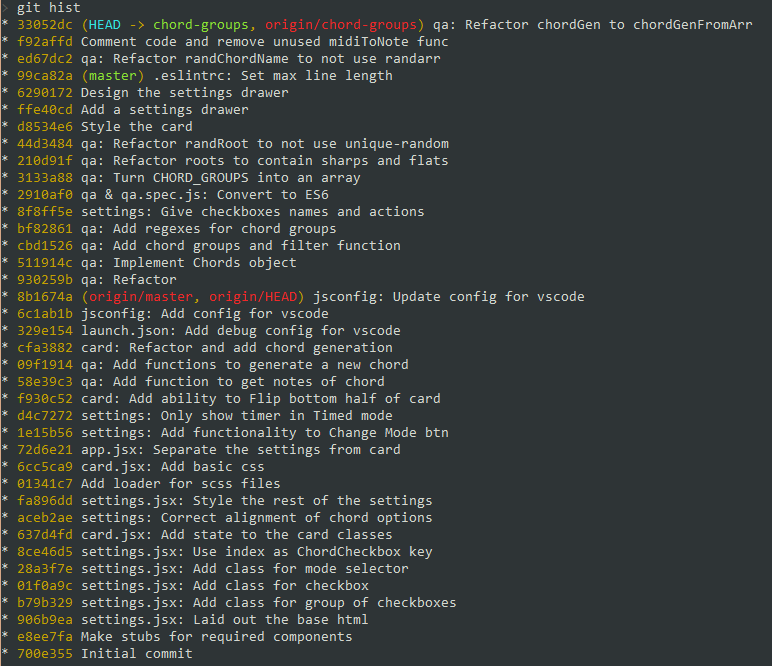
Here is the graph I get when running the command `git log --graph --oneline --decorate --all`
It's completely linear. origin/chord-groups and master share mutual commits.
image2017-1-19 13:42:2.png
However this is the graph I get in Sourcetree:
image2017-1-19 13:43:12.png
I'm struggling to understand why the graph isn't linear. The graph implies that chord-groups and master don't share the same history.
2 answers
1 accepted

Check to see if SourceTree is displaying commits in "Date Order" or "Ancestor Order", and try switching it. I've seen other people report situations where somehow using one or the other results in a situation where SourceTree displays a child commit lower on the list than its parent, and that completely destroys its ability to render correct lines.
I spent ages trying to work this out and the fix was so simple. Thanks! ![]()
You must be a registered user to add a comment. If you've already registered, sign in. Otherwise, register and sign in.
Decided to just use the shell on it's own from now on. Using sourcetree has started to become more and more of a drag.
You must be a registered user to add a comment. If you've already registered, sign in. Otherwise, register and sign in.

You must be a registered user to add a comment. If you've already registered, sign in. Otherwise, register and sign in.