A pop-up survey could appear while you're here--curious what it's for? Click here to learn more!
×Community resources
Community resources
- Community
- Products
- Confluence
- Questions
- JIRA Macro for Confluence and concatenating additional confluence table
JIRA Macro for Confluence and concatenating additional confluence table

All,
I would like to do the following:
A visual that includes:
1. JIRA stories by a certain order
2. live JIRA information like you get in JIRA Macro filter. JIRA #, summary, sprint, priority, status, issue links
3. additional columns to the JIRA information with text I can input.
I was thinking of: making the confluence section with 2 parts.
Put the JIRA Macro in left part, make a regular confluence table in right part and try to align rows.
I wouldn't mind having to cut/paste the JIRA information from a JIRA search each week if needed.
Suggestions would be appreciated.
1 answer

Hi @Joan O"Neill ,
We can recommend to use our app - Table Filter and Charts for Confluence.
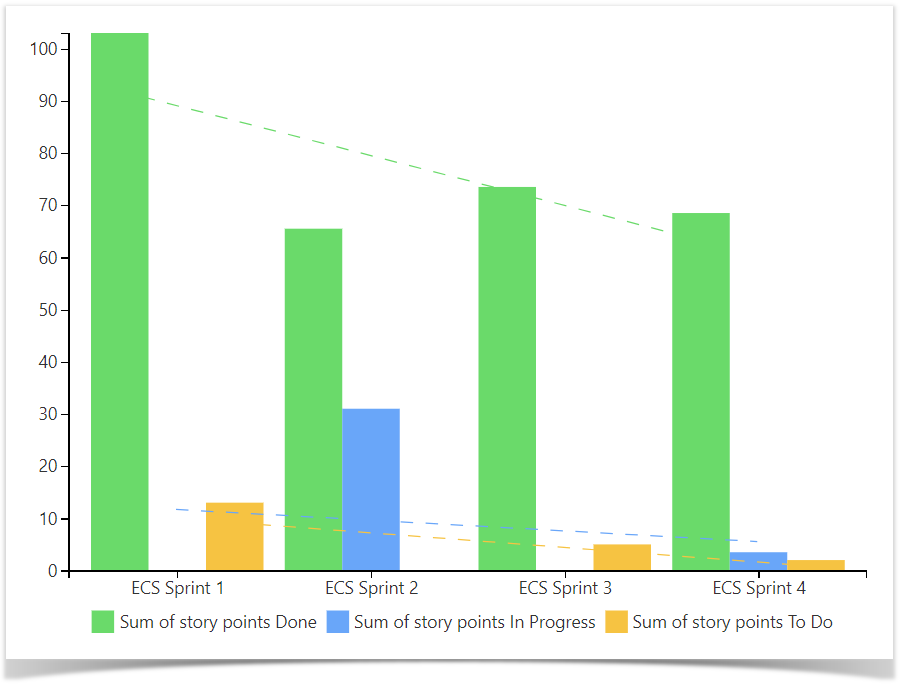
It works with the Jira Issues macro perfectly well and you'll be able to create visualized dashboards right in Confluence.

If you need to add more information, for example, to the pivots based on your Jira Issues macro, you can create additional native Confluence table and merge the two tables with the help of the Table Transformer macro.
As your hosting is Cloud, you'll need to use the Table Toolbox macro to nest several macros. Other steps will be similar to the use cases in our documentation.

You must be a registered user to add a comment. If you've already registered, sign in. Otherwise, register and sign in.