Community resources
Community resources
Community resources
- Community
- Products
- Jira Service Management
- Questions
- View in graphs or lists the count of time in which an incident is resolved
View in graphs or lists the count of time in which an incident is resolved
Good afternoon
Could you help me by indicating how I can graph or view the resolution time of an incident in lists, we review this by week and month but I found that a time can be assigned in the Work Log.

But when you want to graph it, I don't find it as a value to add and I tried it with the Workload Pie Chart but everything looks very generic and not by days or by people.
I remain attentive to your comments.
Thank you

5 answers
Hello @Dora Judith Martínez Vera 👋
You can easily have graph or view the resolution time of an incident in lists with Time in Status report in Time in Status for Jira. You can see resolution time for each task in Total.
Also add-on supports three types of graphs: Pie, Bar, and Area Charts.
And if you need detailed information to know how many time each assignee spend on the ticket you can see this in assignee report.


Add-on developed by my SaaSJet team and has a 30-day free trial version. So you can give it a try. Please, let me know if you have any questions.
Hope it helps 😌
Hi @Dora Judith Martínez Vera ,
I wonder if the Time to Resolution reports would fulfill your requirements? You can create these reports under the Reports section for your JSM project. of course, assumes that you are using SLA and specifically the time to resolution SLA.
You must be a registered user to add a comment. If you've already registered, sign in. Otherwise, register and sign in.
Hello @Dora Judith Martínez Vera ,
Resolution Time and Work Logs are two completely different things.
Resolution Time (or any other similar metric) measures how long it took for the issue to move from one status to another (for Resolution Time, it is probably the time from Open to Resolved).
Worklogs however are the time spent on that issue by individual users.. It is related to cost calculation. An issue might be opened but nobody worked on it for some time and when you started working on it, it was resolved very quickly. It that case, the worklog will be much lower that the resolution time. In contrast, more than one person might have spent time (and entered worklog) on an issue so the worklog might be much higher than the resolution time. Both have different uses.
For worklogs, the times spent on issues have to be logged manually by your users. For other time based metrics, marketplace apps using Jira's issue histories can be used.
If you are OK with using a marketplace app, I can recommend Timepiece - Time in Status for Jira which is built by my team at OBSS. It is available for Jira Server, Cloud, and Data Center.
Time in Status mainly allows you to see how much time each issue spent on each status and on each assignee.


Time in Status offers two report types for your case:
The first one is Status Duration report (please see the screenshot above) which shows how much time each issue spent on each status. You can combine status times to see measurements like Issue Age, Cycle Time, Lead Time, Resolution Time etc.
As an alternative approach, Time in Status also has Duration Between Statuses report type which shows the duration between two specific statuses. This report type also allows the user to exclude the times for "pause" statuses.


These reports show a list of issues by default so you can see the metric values for each issue separately. Also, for all numeric report types, you can calculate averages and sums of those durations grouped by the issue fields you select. For example total cycle time per customer (organization) or average resolution time per sprint, week, month, issuetype, request type, etc. The ability to group by parts of dates (year, month, week, day, hour) or sprints is particularly useful here since it allows you to compare different time periods or see the trend.
All these report types, including averages and sums, can be turned into charts.
Time in Status calculates its reports using already existing Jira issue histories so when you install the app, you don't need to add anything to your issue workflows and you can get reports on your past issues as well. It supports both Company Managed and Team Managed projects.
Time in Status reports can be accessed through its own reporting page, dashboard gadgets, and issue view screen tabs. All these options can provide both calculated data tables and charts.
And the app has a REST API so you can get the reports from Jira UI or via REST.


Timepiece - Time in Status for Jira
EmreT
You must be a registered user to add a comment. If you've already registered, sign in. Otherwise, register and sign in.
just to add to Jack's answer: If you are open to solutions from the Atlassian Marketplace, you may want to have a look at the app that my team and I are working on, JXL for Jira.
JXL is a full-fledged spreadsheet/table view for your issues that allows viewing, inline-editing, sorting, and filtering by all your issue fields, much like you’d do in e.g. Excel or Google Sheets. It also comes with a number of so-called history columns that aren’t natively available, including the time between created and resolved.
This is how it looks in action:

As you can see above, you can easily sort and filter by the resolution time, and also use it across JXL's advanced features, such as support for (configurable) issue hierarchies, issue grouping by any issue field(s), sum-ups, or conditional formatting. JXL also works great with any SLAs, if you're using them in your team.
Any question just let me know,
Best,
Hannes
You must be a registered user to add a comment. If you've already registered, sign in. Otherwise, register and sign in.
Hi @Dora Judith Martínez Vera,
A good method to track "time to resolution" (TTR) is to measure the time an issue spent between its creation and the moment is was moved to a resolved/done status.
You can easily do this by using the gadgets offered by our Great Gadgets app.
For example, with the Cycle Time Trend Gadgets you can display the average time to resolution for the tickets of your team along with the trend line.

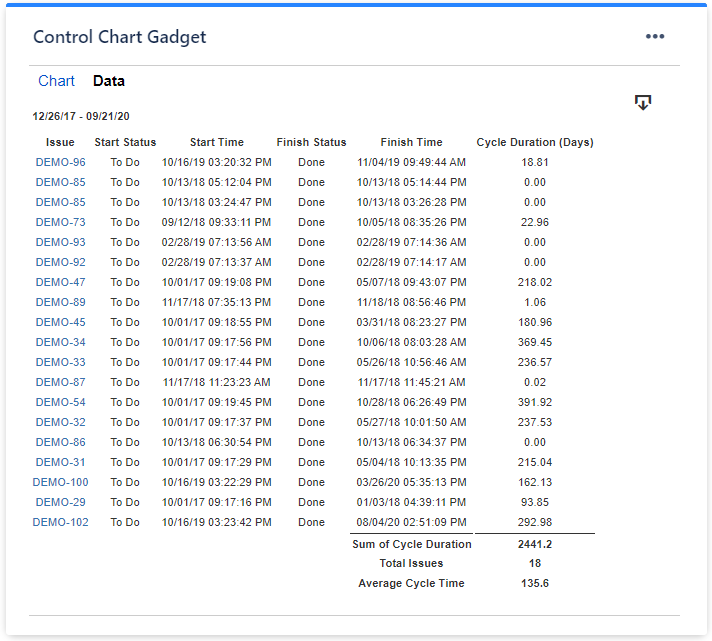
With Control Chart gadget you can see a scatter-plot diagram with the issues of your team, by time-to-resolution. This gadget allows you to see the time to resolution for each issue and to identify the ones that took longer than expected (the ones in red-color).

Another example is the Histogram Chart, which can show the dispersion of the time-to-resolution and how many issues breached the SLA.

All these gadgets offer a report on their Data tab, with details about every issue and their time-to-resolution.
Please note that this app offers many other useful gadgets, so it can be a great asset for your team. Have a look over the articles from our blog, to see how many things you can track with this app, especially this one: An effective dashboard for Service Desk and Customer Support teams in Jira Service Management .
Danut
You must be a registered user to add a comment. If you've already registered, sign in. Otherwise, register and sign in.

You must be a registered user to add a comment. If you've already registered, sign in. Otherwise, register and sign in.