Community resources
Community resources
Community resources
- Community
- Products
- Jira Service Management
- Questions
- can I display sla time remaining in jira service desk queue or report?
can I display sla time remaining in jira service desk queue or report?
We are currently using Vertygo SLA and I can see the vertygo sla custom fields in the issue navigator, color coded to show which are close to being overdue and which are not.
I'm evaluating JIRA service desk and I can't find any way to see the time remaining in any SLA without first opening each individual JIRA issue.
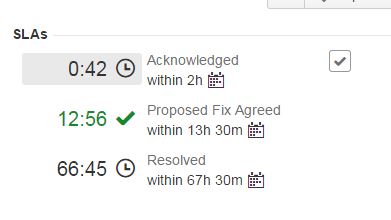
I have 3 SLA metrics, Acknowledged, Fix Agreed and Resolved.
Thank you.
2 answers
1 accepted
any idea why my first metric, Acknowledged, doesn't appear with the green check mark since it was completed in time? (I will try to add a screenshot)
You must be a registered user to add a comment. If you've already registered, sign in. Otherwise, register and sign in.
You must be a registered user to add a comment. If you've already registered, sign in. Otherwise, register and sign in.
Can you see the metric Aknowledged when you open the issue?
You must be a registered user to add a comment. If you've already registered, sign in. Otherwise, register and sign in.
I have the Same issue i have added the column "Time to Resolution" to the Queues but its not showing the Time Stamp (Remaining Time for SLAs). But when i open the Ticket individually then its showing the SLA time there.


You must be a registered user to add a comment. If you've already registered, sign in. Otherwise, register and sign in.
You must be a registered user to add a comment. If you've already registered, sign in. Otherwise, register and sign in.

You must be a registered user to add a comment. If you've already registered, sign in. Otherwise, register and sign in.